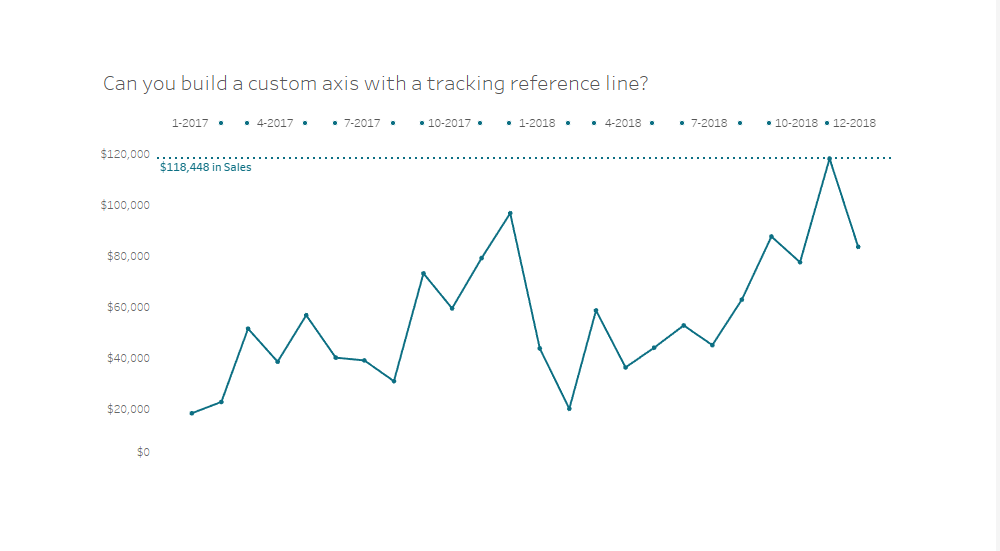
Week 36: Can you build a custom axis with a tracking reference line?
After four amazing challenges from the Tableau Community, we are back in the drivers seat to provide you with this week’s challenge! For your challenge this week, we are focused on interactivity over anything else; This week is simply about getting to know the tool and being creative with your data solutions. So can you …
Week 36: Can you build a custom axis with a tracking reference line? Read More