2026 Week 03 | Sigma: Running Feedback Loop
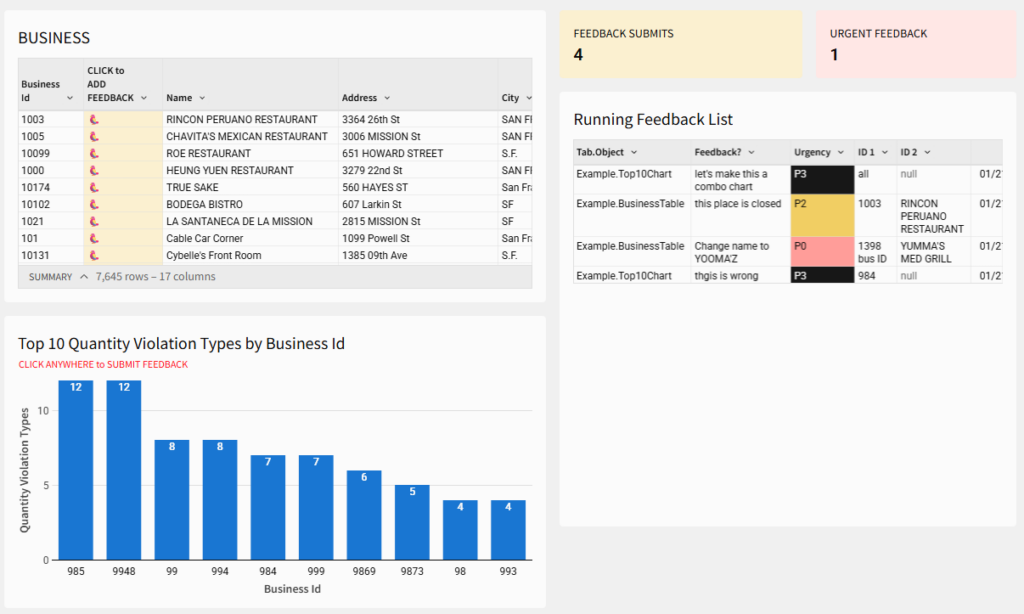
Introduction This week’s Workout Wednesday is about turning feedback into part of the workflow, not a side conversation. You’ll build a lightweight, in-workbook feedback loop in Sigma that lets stakeholders flag issues directly on tables and charts, with context intact. Instead of comments that disappear or Slack messages that pile up, feedback becomes structured, reviewable, […]
2026 Week 03 | Sigma: Running Feedback Loop Read More »