2020 week 8: Can you create a concatenated list of values?
There is still a need for legacy reporting, how can we use Tableau to create a report where one row contains all the data? Here’s how to create a concatenated list of values
Introduction At the last North West Tableau User Group, I watched a presentation from Ryan Lowers and Nathan Leather where they looked at using parameters as a data source. You can see their workbook here. So this week we are focusing on using Parameters as a Data Source. How can we add data to the current data we have. …
Week 7: What happens if? Can you update sales forecast and targets using only parameters? Read More
Introduction This week’s challenge is ripped directly from two different requests I had over the past week. The idea is simple, create a single visualization that displays performance in different metric categories and provide an overall health indicator. This concept may look very familiar for people accustomed to KPI indicators in Excel (or dare I …
Introduction This week I wanted to share a challenge that comes from a chat that I had with Zach Bowders near the beginning of the year. Zach was shared a step-ranking visualization he was putting together and I really thought it was a great iteration of the chart type. While there have ben step-ranking charts …
Introduction Well here we are! My first week as an “official” contributor of #WorkoutWednesday! I’m so excited to share my three (3) challenges with you so let’s get to it with the first one. In my day to day life at Cerner, I build analytics that cast a wide net of user personas with all …
Week 04: Can you combine relative and custom dates? Read More
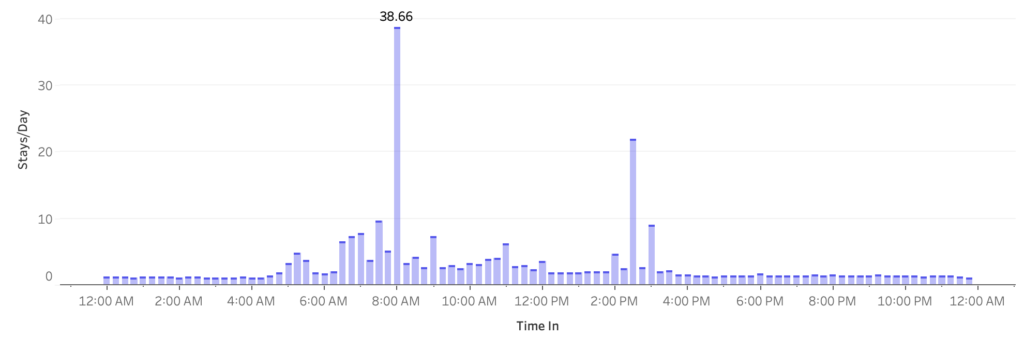
Introduction This week, I wanted to take a look at how people could visualise time in a unique way. My idea around this is planning. Looking at time in this manner allows people to look at workload / order load etc and see where was most and least popular, which will allow planning for the …
Introduction Happy New Year! I’m excited to be back for yet another year of Workout Wednesday. This year we’ve expanded the team and made a commitment to the community to provide solution videos. We’ve also got some great collaborations lined up, and a few exciting enhancements to come (custom color palette anyone?)! To get the …
2020 Week 2: Can you build a beautiful and dynamic bar chart? Read More
Introduction We’re back in 2020 with a whole new set of challenges. This month you’ll see challenges from Lorna, Ann, Sean, and myself. I’m starting this year off with a bar chart/data table because in our day-to-day we are always looking for a way to spice up our charts. To spice up these charts we …
Week 1: Can you sort dimensions with a single click? Read More
I feel completely honored to have spent a year working with Ann, Lorna, and Luke on this amazing project. I truly believe that Workout Wednesday is simply one of the best ways to skill up in Tableau, and if you regularly participate, you’ll quickly find yourself surpassing others in your profession and setting yourself apart …
I thought I would end the year with a simple Sales Performance dashboard. It is a recreation from Pradeep Kumar G‘s viz. What I love about this viz is how simplistic it looks and sticking with a “Brand”. This week, we create something similar, keeping it simplistic and on “Brand” Requirements Dashboard 1000 x 800 …
#WorkoutWednesday2019 Week 51 – Sales Performance Dashboard Read More