Introduction
Last week the challenge was how to create a quasi-histogram in CRM Analytics. Here is my solution, hope you guys like it. If you used a different solution, share it with us in the comments.
Solution
- Let’s start by getting any numeric value from our dataset. You can upload your dataset. I am using the Amount column from Salesforce’s Opportunity object.
- The next step is to order our data. A histogram is always ordered from the lowest to the highest in our dataset. So let’s project our metric and order it ascending.

- Now, to properly be able to create our histogram, we need to insert all the values in our dataset within same-sized bins. We could use the case statement for that, but we’d need to create a case condition for each of our buckets, and we may end up writing an enormous formula, which would also be a fixed number of buckets. The solution I found is simpler and more dynamic. We’ll pick a value for our buckets, for example 10000, so our buckets would be 1-9999,10000-19999,20000 and so on. By dividing the values in our dataset by 10000, any number smaller than 10000 would result in a value smaller than 1 (ex 5000/10000 = 0.5), and everything greater than 10000 and smaller than 20000 would have a division result smaller than 2, and so on.

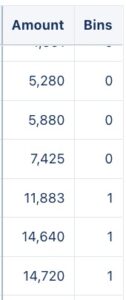
- Ok now we have our equal-sized bins, but it’s still a number, we need to transform this into a string containing the lowest and highest values for that particular bin. To do this, we will multiply our bin value by 10000 again, transform it into a string, and concatenate it with the same bin value + 1. Then we’ll group our data by our new string field and project the values count per group and the bins.

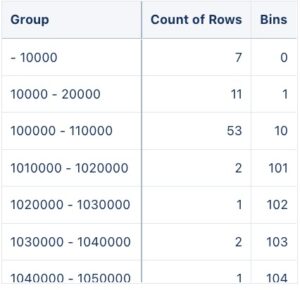
- Now we have 2 problems, the first is that once we transform our numbers into a string for the group, it will not be sorted as numbers anymore, but as a string, messing up our sorting order. The second problem is more sutile, look at the first 2 rows, we have bins from 0-10000 and 10000-20000. The value 10000 falls into 2 different bins (this happens for any lowest value and highest value of the previous bin in our dataset). Let’s fix this by subtracting the next bin value in our string by 1. Then, we’ll sort the order of our dataset by bins, not the group.

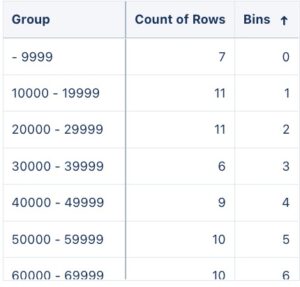 Our histogram looks ready and perfect, but there is a problem. Histograms create bins and distribute these bins in the X axis of a bar chart, If no value in our dataset falls on a particular bin, that bin will still be ploted in our axis with the value of 0. This is not happening with our data. The bin 4350000 jumps to the 4700000. We should have all the bins within these ranges plotted with a 0 value in a truly accurate histogram.
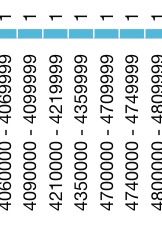
- Unfortunately, we cannot solve this challenging (maybe you can haha) issue, but we can insert a single break value indicating when the bins skip values. For this, we’ll get the previous value of our bins with a windowing function, and filter our data to get any rows that the current bin is not the previous bin +1. Then, we’ll regroup our data, and generate every row as the string Break concatenated with the row number of the break data. We’ll project 0 as our count because it represents 0 records within the bin ranges. This is the resulting query.

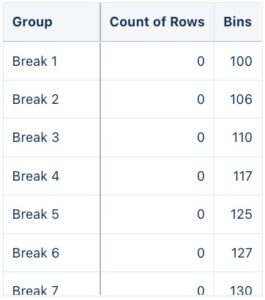
- Now that we have our Histogram and our breaks, let’s union, regroup, and reproject our data.


- And there we have it. A quasi-histogram chart. Each skipped bar is one of our breaks. If you want, you can insert an input widget and replace your 10000 value with any value to change the bin sizes of your histogram.
Share
After you finish your workout, share a screenshot of your solutions or interesting insights.
Either on Twitter using the hashtags #WOW2024 and #CRMA and tag @genetis, @LaGMills @msayantani, and @simplysfdc. (Or you can use this handy link to do that)
Or on LinkedIn, tagging Alex Waleczek, Lauren Mills, Sayantani Mitra, Phillip Schrijnemaekers and Johan Yu using the hashtags #WOW2024
Also make sure to fill out the Submission Tracker to track your progress and help us judge the difficulty of our challenges.