Introduction
For this week’s #WorkoutWednesday we’ll recreated one of the PowerBI challenges from earlier in the year. In week 30, Shannon created a visualisation of sea ice extend in the Antarctic. Initially I thought this would be a rather easy challenge in CRMA but I ended up with a few tricky nuts to crack.
Requirements
- Create a data source that enables the requirements and the dashboard below
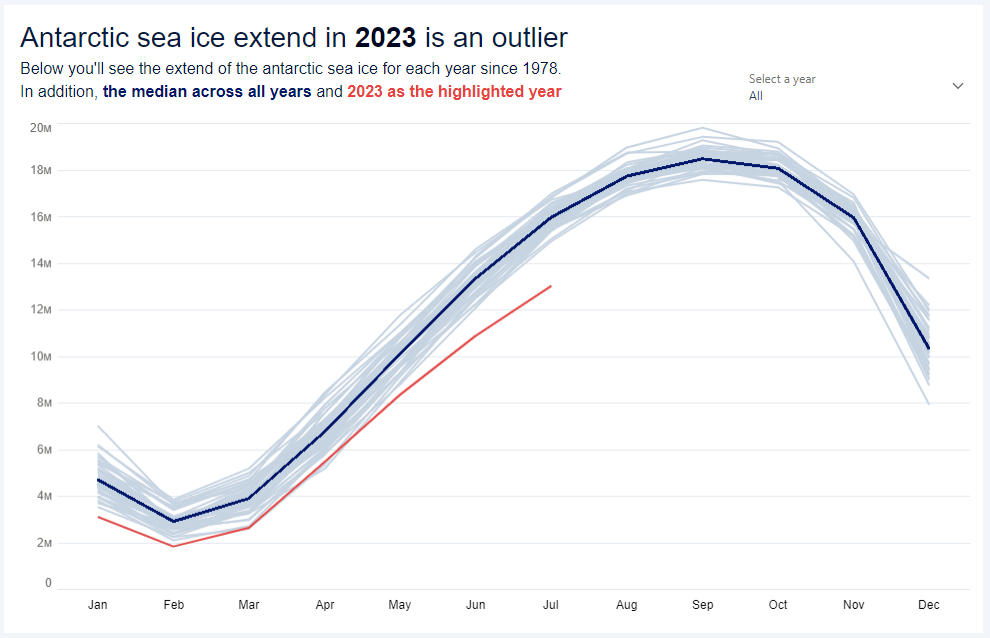
- Line chart
- Show one line per year
- Show all months in each year in the correct order
- Use 3 letter month names
- colour all years in grey
- colour 2023 in red
- colour the median value for each month in dark blue
- match axis formatting
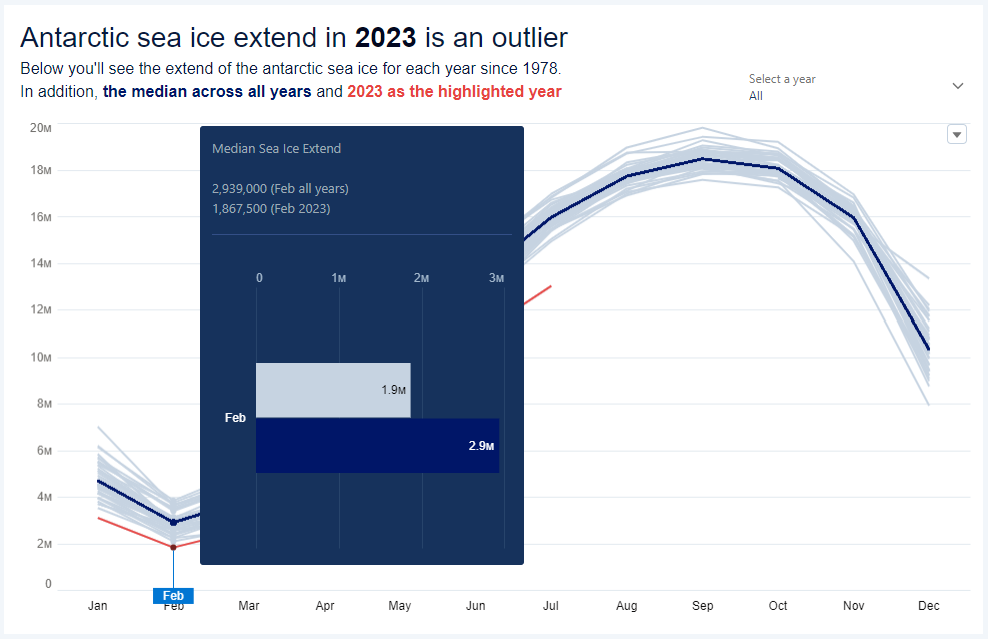
- create a tooltip that shows the selected value and the overall median and includes a bar chart showing the same values
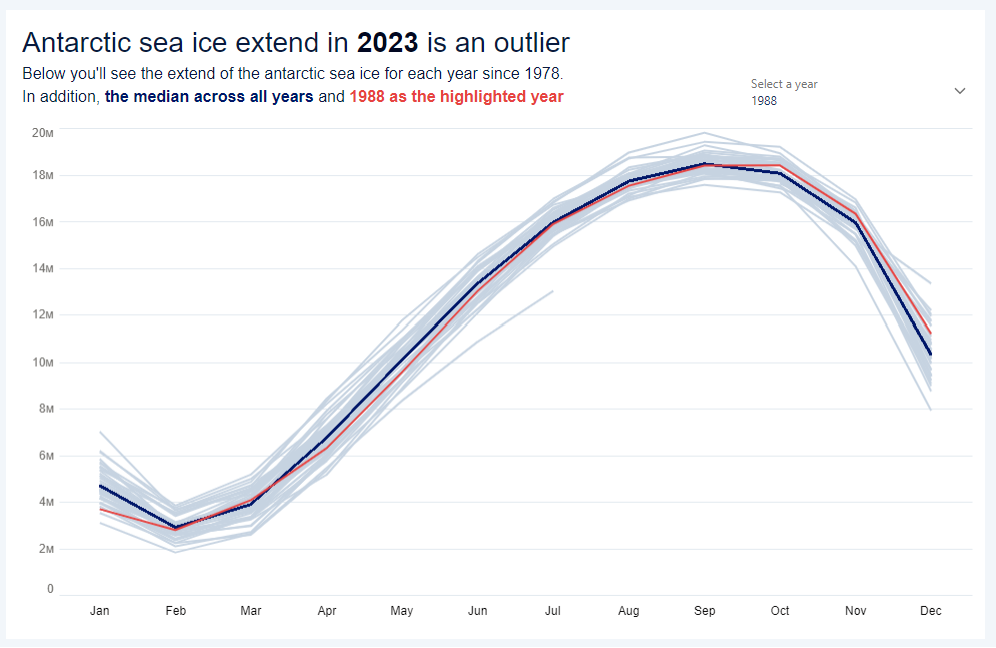
- Year selector
- Allow the user to select any year in the data set
- Colour the selected year red instead of 2023
- Title
- Match formatting
- change the red “2023” to the selected year, if the user has a different year selected
The resulting dataset should look something like this: