Introduction
This post is special! It has been sent by Pedro Gagliadri who has been working on CRM Analytics since it was called Wave! Yes, some of us have been using this tool forever!
Now for the challenge:
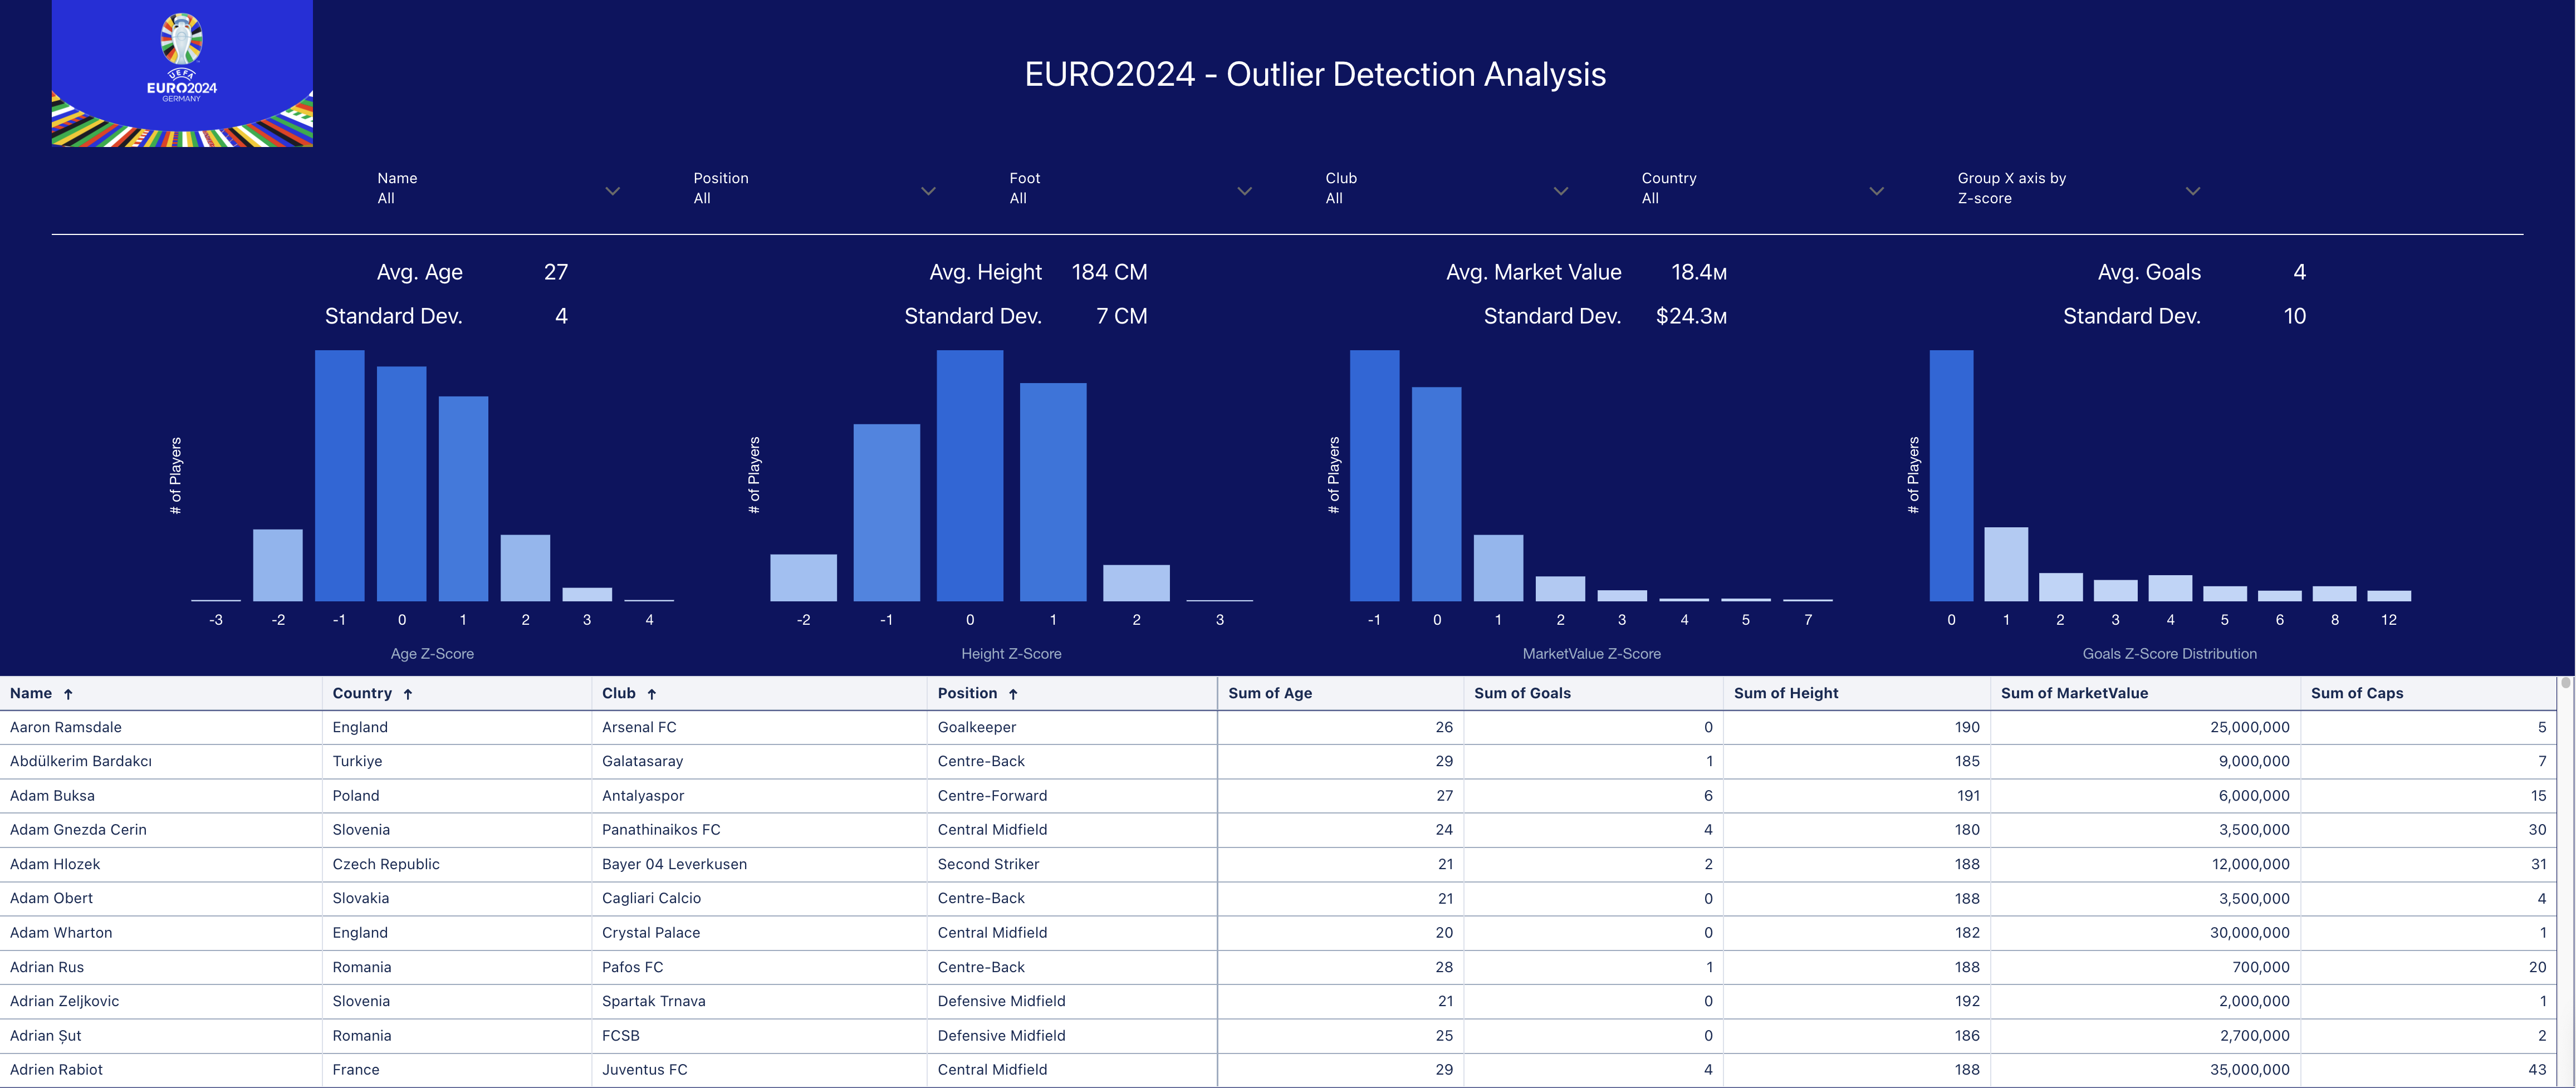
This Outliers Detection will use Z-Scores. Prepare a recipe and a dashboard that allows you to see the outliers, using Z-Scores, in different categories: Age, Height, Market Value, and Goals. The theme of the data is the Soccer Tournament EURO2024.
Requirements
- Create a dev org or use one you have access to
- Make the necessary transformations on a recipe or dashboard to produce the Avg, Standard Dev, and Z-Scores.
- Create a dashboard that shows bar charts with the distributions for Age, Height, Market Value, and Goals.
- Add a detailed table to see all the players
- You should be able to answer these questions:
1 – Who is the youngest/oldest player and how far are they from the mean?
2 – How close/far away from the mean Cristiano Ronaldo is in Goals?
3 – Is the data normally distributed?
The resulting dataset should look something like this:

Using Recipes maybe easier!
Dataset
Euro Players 2024 dataset can be found here.
Share
After you finish your workout, share a screenshot of your solutions or interesting insights.
Either on Twitter using the hashtags #WOW2024 and #CRMA and tag @genetis, @LaGMills @msayantani, and @simplysfdc. (Or you can use this handy link to do that)
Or on LinkedIn, tagging Alex Waleczek, Lauren Mills, Sayantani Mitra, Phillip Schrijnemaekers and Johan Yu using the hashtags #WOW2024
Also make sure to fill out the Submission Tracker to track your progress and help us judge the difficulty of our challenges.