Deneb

2025 Week 23 | Power BI: Highlight on Hover with Deneb

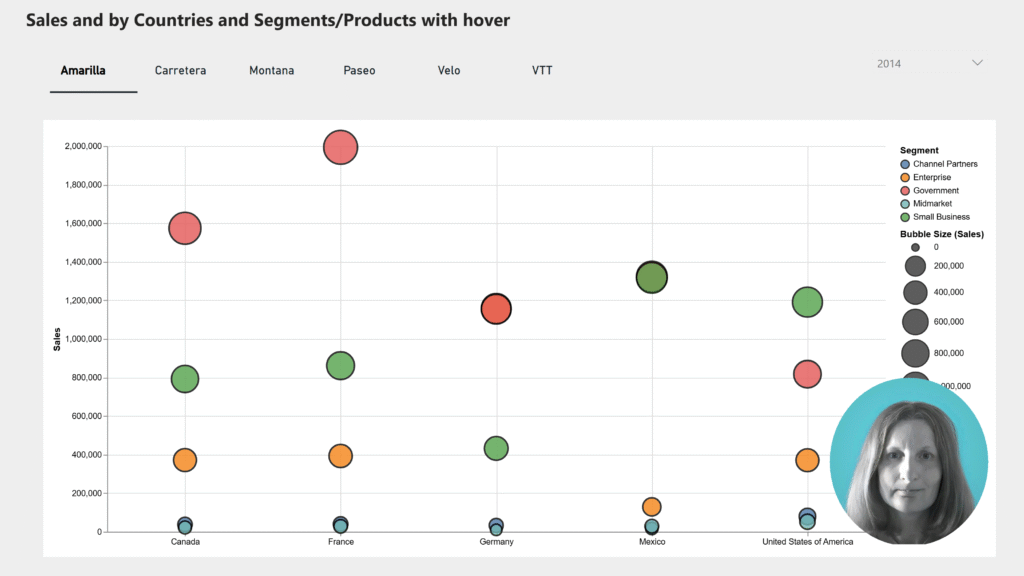
Introduction What do you want to highlight on hover? Practice with the Deneb Custom Visual. This week’s challenge was created using the Deneb custom visual in Power BI. I was inspired by the many examples on the Vega-Lite website. The chart displays Sales and Profit grouped by country and segment, based on a sample Power …

2025 Week 23 | Power BI: Highlight on Hover with Deneb Read More

Screenshot of a skyline chart created using Deneb in Power BI

2025 Week 18 | Power BI: Create a skyline chart

Introduction Hello everyone! This week we are looking at developing a ‘Skyline’ visual.   Anyone outside of the construction industry may not have heard this term before, but it is kind of a combination of a stacked column visual and a kanban board.   It is used in construction to show construction activities (workpacks) that …

2025 Week 18 | Power BI: Create a skyline chart Read More

Screenshot of a globe created using Deneb in Power BI

2025 Week 4 | Power BI: Create a Rotatable Globe with Deneb by Ying Fu

Introduction Welcome back to Workout Wednesday! This week we’re having fun with the Deneb custom visual and learning from another one of our fabulous Power BI community members, Ying Fu. Ying has been sharing on LinkedIn and I’ve had so much fun exploring their GitHub repo. Today we’re using a rotatable globe to look at Chinese migration abroad. Ying …

2025 Week 4 | Power BI: Create a Rotatable Globe with Deneb by Ying Fu Read More

2024 Week 41 | Power BI: Visualize a Drag Race with Animation

Introduction There are a few ways to visualize movement in Power BI. This week, we are visualizing race cars moving on a track. The example report below uses Deneb, but you could also complete this challenge by combining a custom visual and the Play Axis visual.  In the report below, once you click the Go …

2024 Week 41 | Power BI: Visualize a Drag Race with Animation Read More

2024 Week 33 | Power BI: Segmented Donut Chart

Introduction Editor’s note: This week we have a guest post from Imran Haq (LinkedIn, X). If you haven’t already, try out his previous WoW contribution to make a jittered column chart.  The segmented bar chart from week 29, inspired some experimentation with similar designs. This week we are making segmented donut charts. These donut charts have 2 …

2024 Week 33 | Power BI: Segmented Donut Chart Read More

2024 Week 29 | Power BI: Remake of a Tableau Segmented Bar Chart

Introduction This week, we are recreating a previous Tableau workout in Power BI in which we build a segmented bar chart that contains a bar for the total amount followed by a bar that shows a categorical breakdown of that amount. This challenge involves a bit of data transformation as well as some more advanced …

2024 Week 29 | Power BI: Remake of a Tableau Segmented Bar Chart Read More

2024 Week 2 | Power BI: Soda Pop Sales in a Jittered Column Chart

Introduction This week we have our first guest post of 2024! Today’s challenge comes from Imran Haq (LinkedIn, X). I have always admired his Deneb skills, so I’m excited to share this report with you today. We are making a jittered column chart with Deneb. The theme of soda (or pop, coke, or whatever you …

2024 Week 2 | Power BI: Soda Pop Sales in a Jittered Column Chart Read More

2023 Week 45 | Power BI: Create a dumbbell chart with Deneb

Introduction Welcome back to Workout Wednesday! This week we’re creating a dumbbell chart to compare 2 sets of values using Deneb! If this is your first time using Deneb I highly recommend you play around with either the Vega or Vega-lite languages in the online editor, where you can load the code from examples, amend it, …

2023 Week 45 | Power BI: Create a dumbbell chart with Deneb Read More

Scroll to Top