Level of Detail

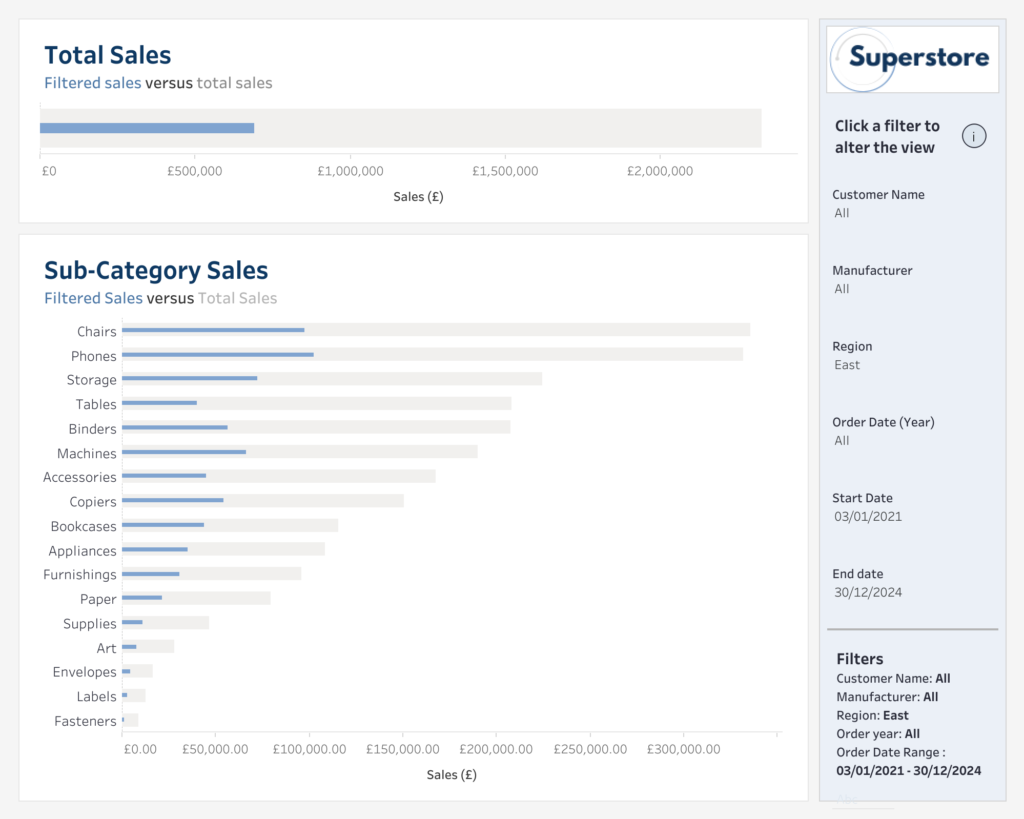
#WOW2024 W43: Can you show total sales and filtered sales in the same view?

Introduction Hello #WOW enthusiasts, I’m Hannah, a data analyst consultant at The Information Lab. This week’s challenge is inspired by a client project I did recently, where I was trying to recreate a specific visual from a different software. I thought I could save you the headache if this kind of problem ever crossed your …

#WOW2024 W43: Can you show total sales and filtered sales in the same view? Read More

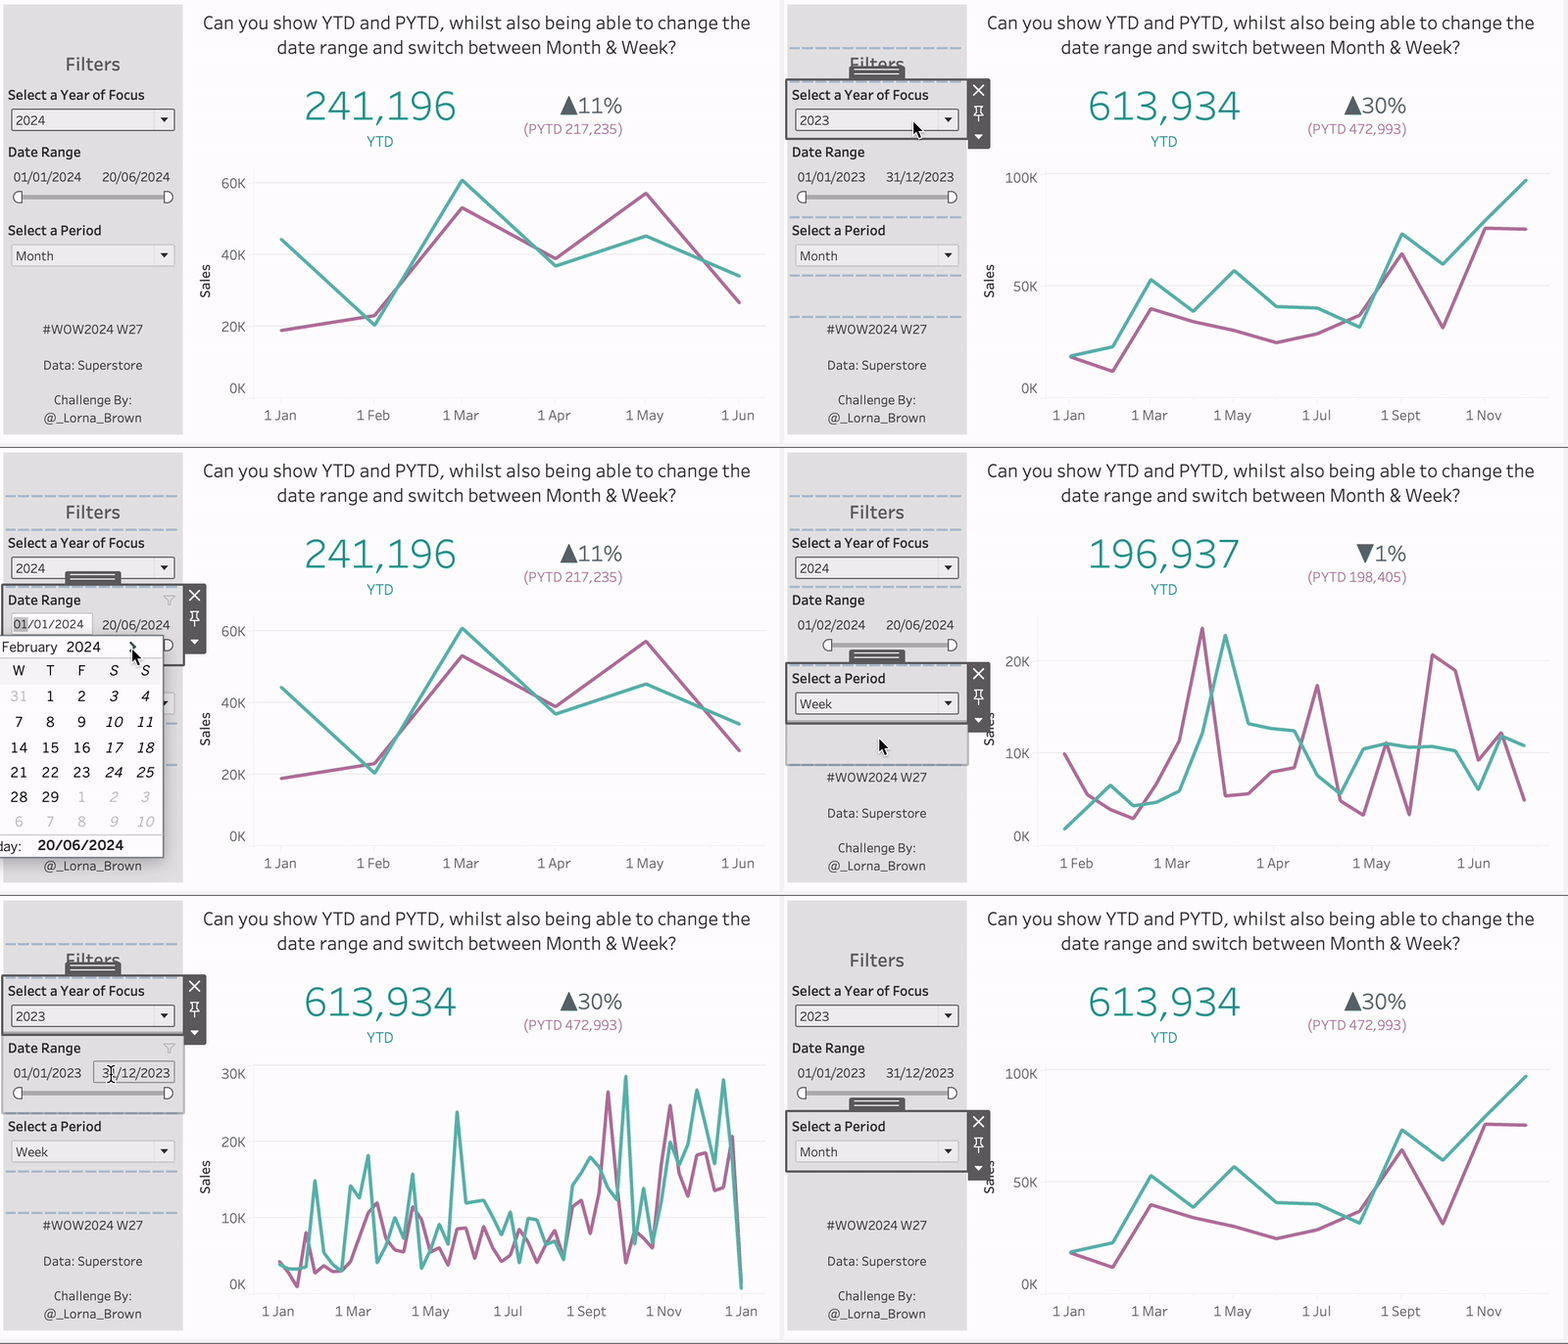
#WOW2024 | Week 27 | Can you show YTD and PYTD, whilst also being able to change the date range and switch between Month & Week?

Introduction One of the perks of my job is that I get to help colleagues solve puzzles that clients throw at them. This is where this came from. Well in fact – the original idea came from a Power BI report, and I wanted to prove it was doable in Tableau.  Click to open in …

#WOW2024 | Week 27 | Can you show YTD and PYTD, whilst also being able to change the date range and switch between Month & Week? Read More

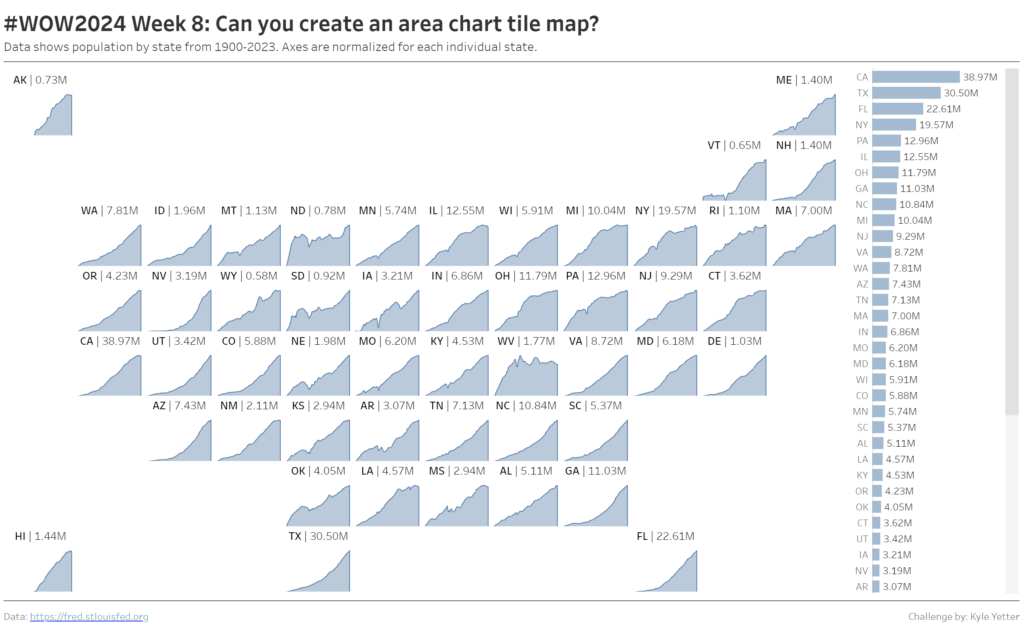
#WOW2024 | Week 8 | Can you create an area chart tile map?

Introduction While reviewing recent work I’ve done in preparation for this week’s challenge, I came across a tile map with individual area charts by state that we use to monitor subscriptions, and thought it would be a fun one. As I dug into it, I realized it was inspired by Luke’s challenge in 2020 Week …

#WOW2024 | Week 8 | Can you create an area chart tile map? Read More

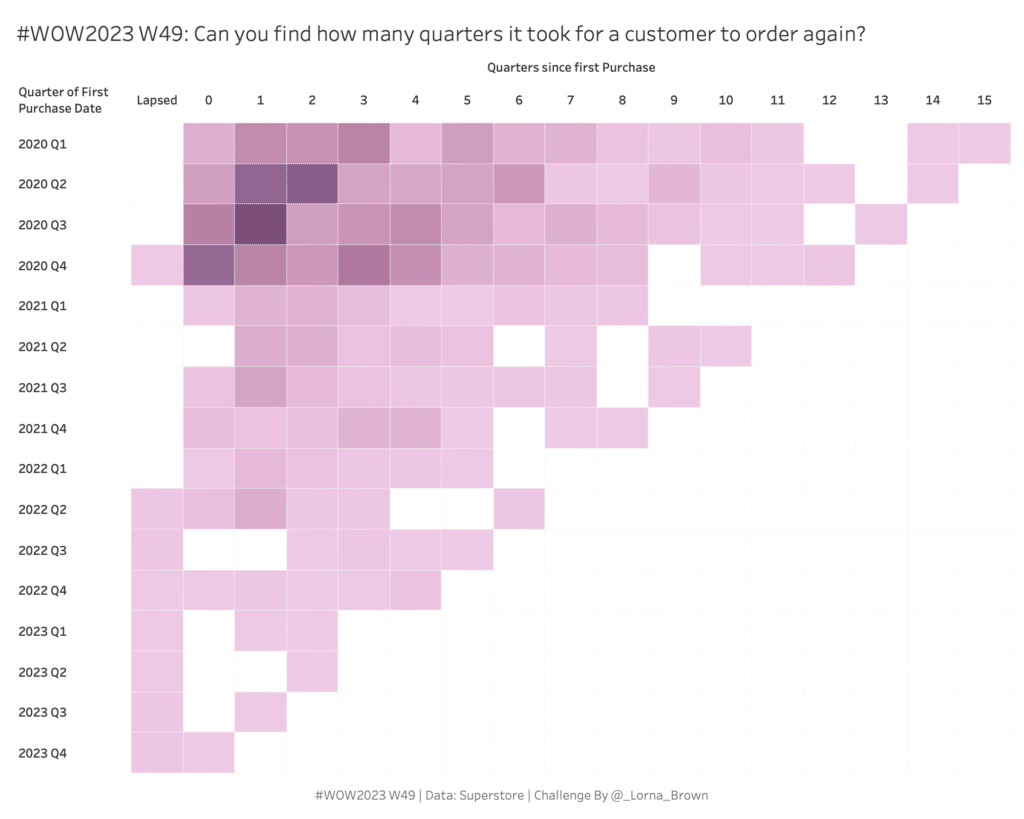
2023 W49: Can you find how many quarters it took for a customer to order again?

Introduction This week I wanted an easier challenge in the lead up to the Christmas Holidays. So what better way than doing some Level of Detail calculations. I want you to be able to find out how many quarters it took for a customer to make their second purchase Click to open in Tableau Public …

2023 W49: Can you find how many quarters it took for a customer to order again? Read More

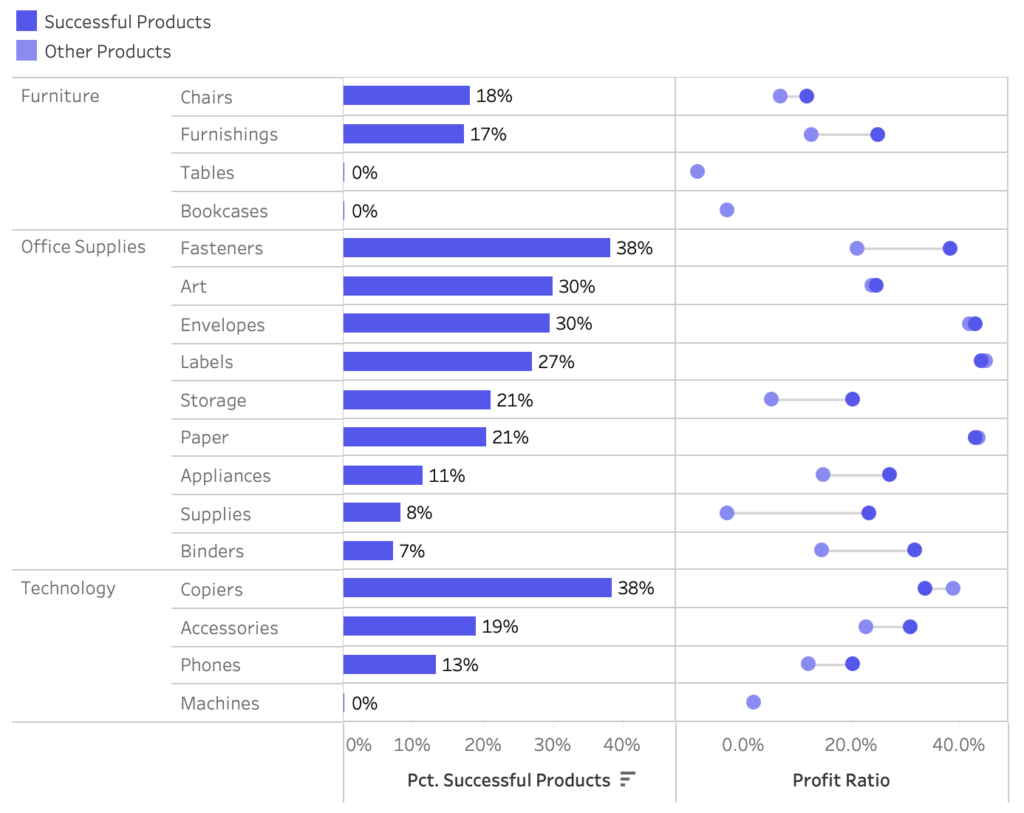
2022 – Week 4: How have successful products performed?

Introduction This week’s challenge looks at products in Tableau’s superstore dataset. In this challenge you will have to find the products that have been profitable in each of the four years in this dataset. That means profitable in 2018, 2019, 2020, and 2021.  Once you have identified successful products (the consistently profitable products) then you …

2022 – Week 4: How have successful products performed? Read More

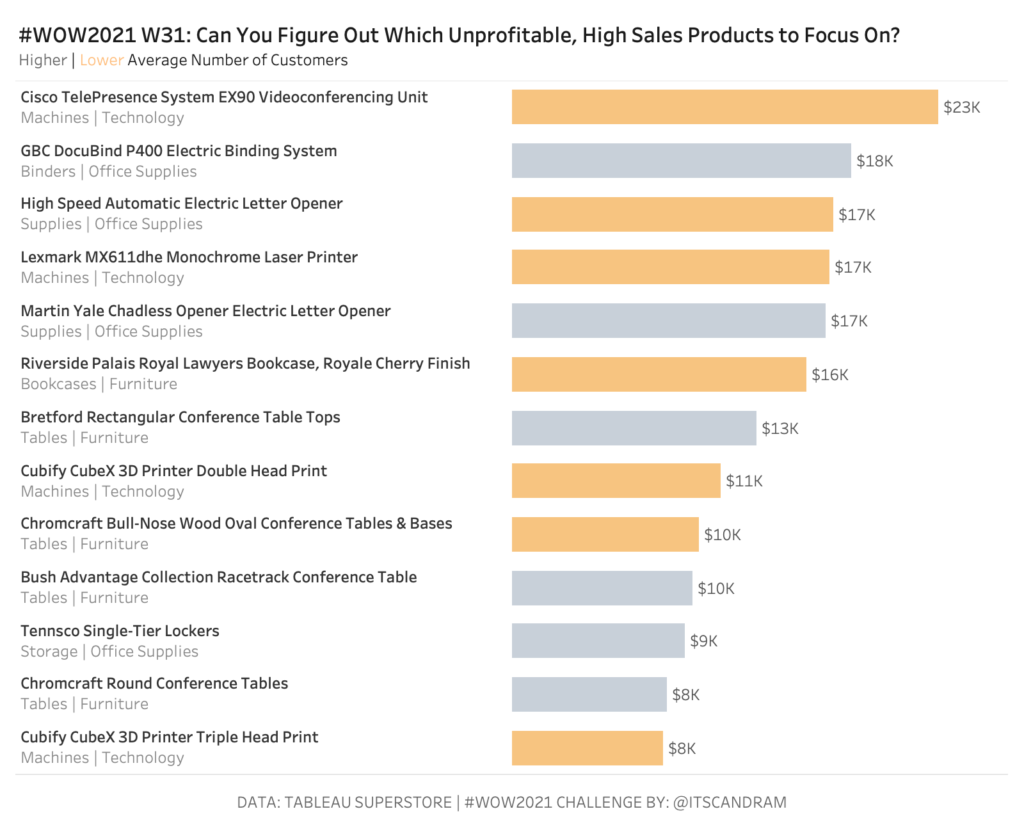
2021 Week 31: Can You Find the Needle in the Haystack?

Introduction The ability to efficiently find the proverbial needle in a haystack is worth its weight in gold.  How many times has a key stakeholder asked you to give them a shortlist of products (insert the focus of your analysis) to focus on for business improvement/optimization opportunities…and they’ve asked you to get back to them …

2021 Week 31: Can You Find the Needle in the Haystack? Read More

Scroll to Top