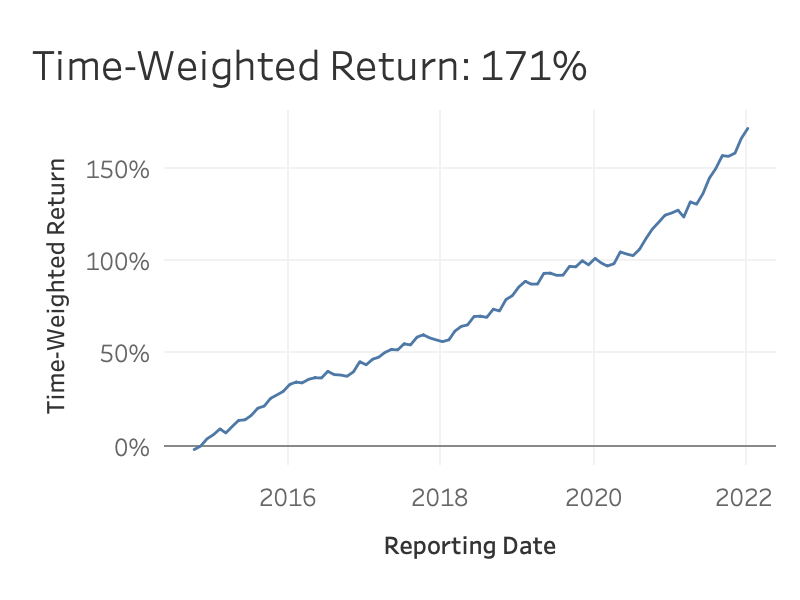
Working with financial data is hard. There are some calculations that make for long evenings to get right. One of those calculations is Time-Weighted Return. This challenge is simple: calculate the Time-Weighted Return Rate for a simple data source and return a line chart.
Add a title that includes the return rate for the final period shown
Match the formatting
Dataset
This week the data was inspired by the Wealth Management Dashboard on Tableau Exchange, but was updated by me for the challenge. You can get it from this Google Sheet.
Report Date = Monthly Report Date Start Value = the starting amount of cash (should match previous month End Value) Flow = the amount of money flowing in or out of the account in that particular month End Value = the ending amount of cash for the month
Attribute
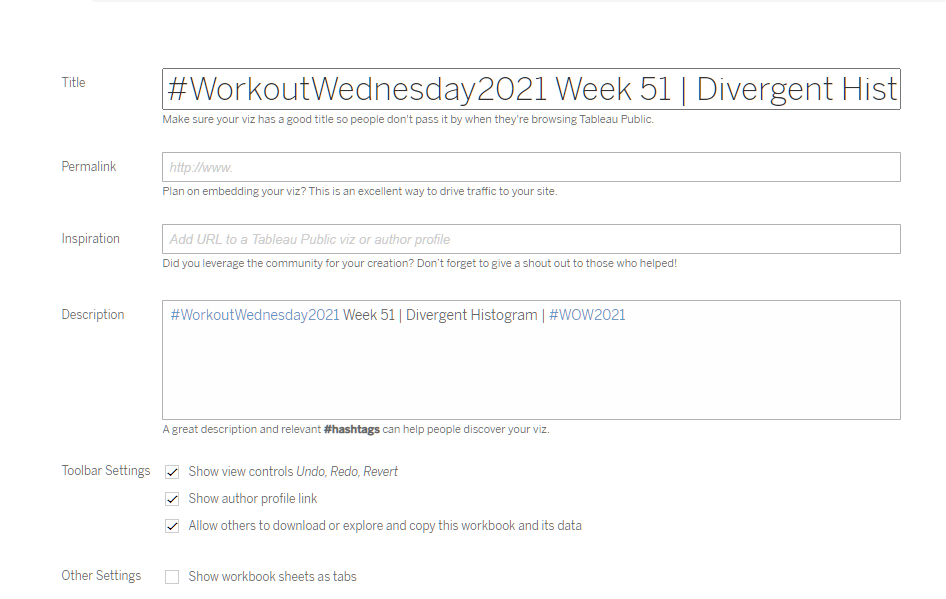
When you publish your solution on Tableau Public make sure to take the time and include a link to the original inspiration. Also include the hashtag #WOW2022 in your description to make it searchable!