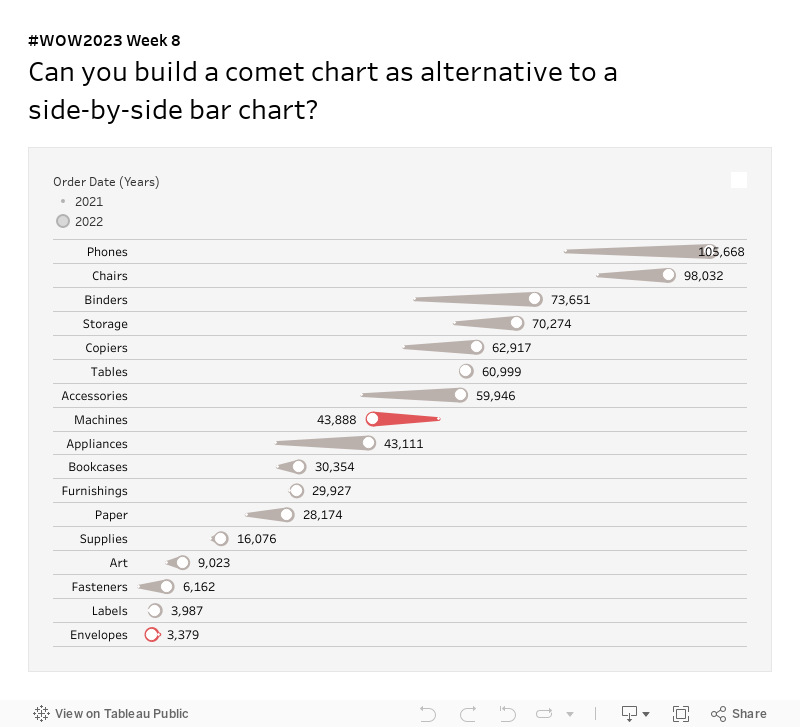
The theme for February 2023 has been alternatives. This week I present an alternative (and trust me, there are many other alternatives) to my least favorite chart: the side-by-side bar chart.
The reason this chart is so difficult for me is because it takes up a lot of space and when I am doing comparisons of numbers I’ve got to cross so many other value and dimensions. I want to make comparisons faster. That’s why sometimes I use a comet chart.
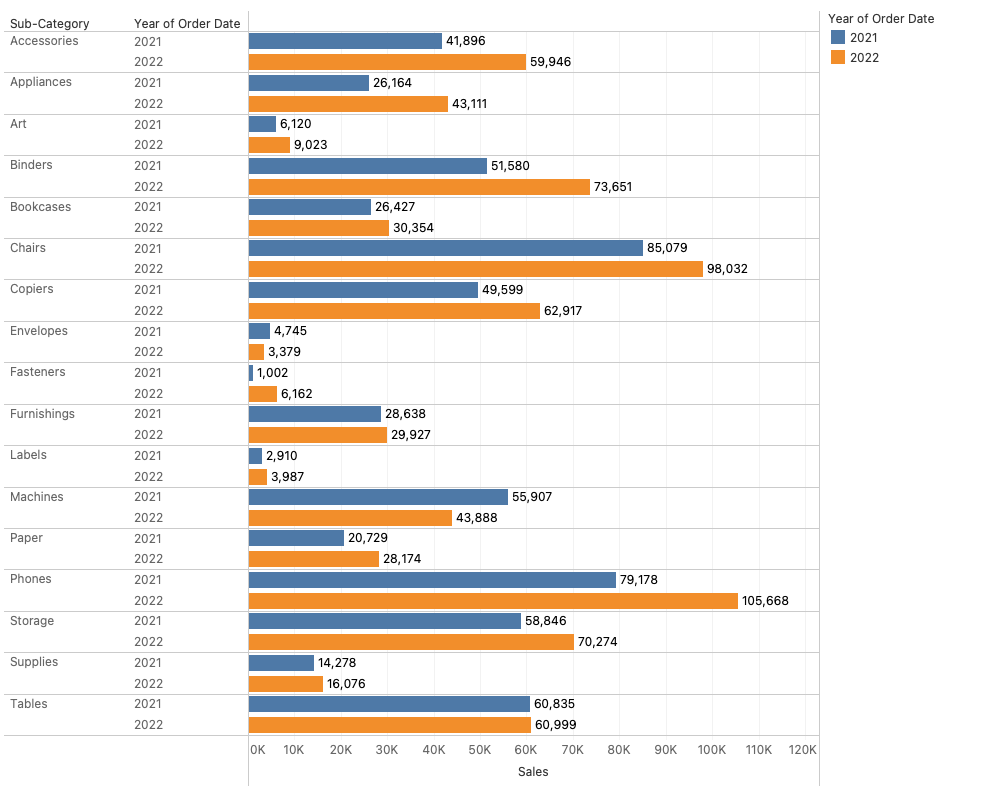
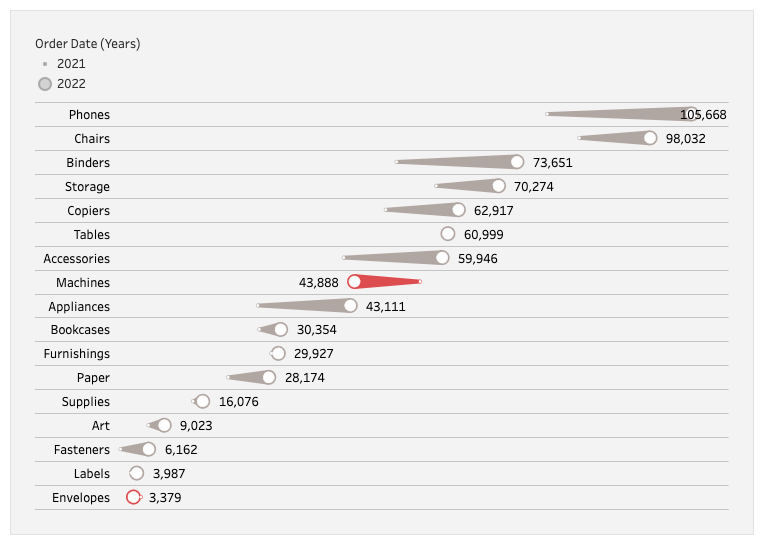
Create a comet plot that shows sales for 2021 and 2022 by sub-category.
The narrow part of the comet should be 2021 sales
The wide part of the comet should be 2022 sales
The labels should be 2022 sales
Match the size of the comet around the circle
The color represents the direction of change in sales from 2021 to 2022. The red represents a decrease in sales
Match the formatting
ADVANCED: Table Calculations only
Dataset
This week uses the superstore dataset for Tableau 2022.4. You can get it here at data.world.
Attribute
When you publish your solution on Tableau Public make sure to take the time and include a link to the original inspiration. Also include the hashtag #WOW2023 in your description to make it searchable!