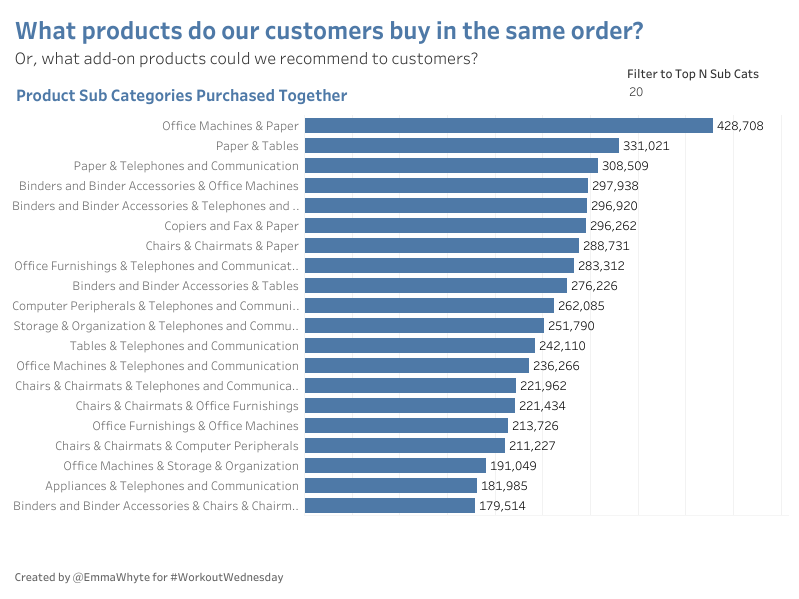
#WOW2017 | 42 | Market Basket
Introduction EDITOR’S NOTE: This challenge was originally published on Emma Whyte’s Tableau blog which no longer exists. This challenge is republished here with the author’s permissions This week’s #WorkoutWednesday requires you to create a Market Basket analysis in Tableau. It’s a common ask, particularly in certain industries like retail. While the visualisation itself might not …