Introduction
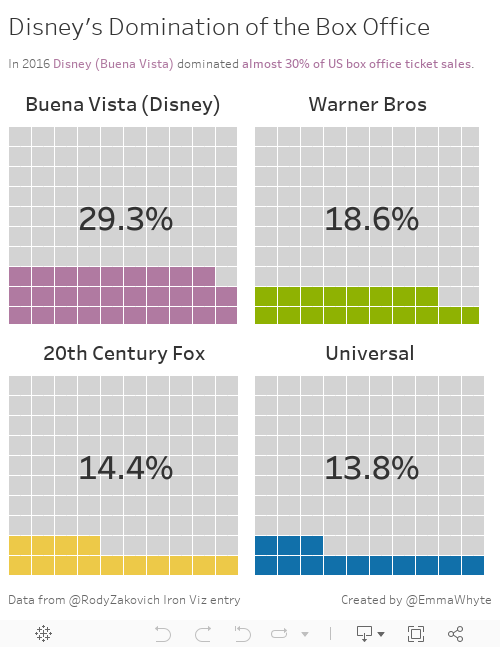
This weeks #WorkoutWednesday is inspired by an IronViz entry from Rody Zakovich. I’m a huge Disney fan and think Rody’s viz is the right balance of informative and eye-catching. I decided to download Rody’s workbook and play around with the data behind it. I could have spent so many more hours than I have done already with this data.
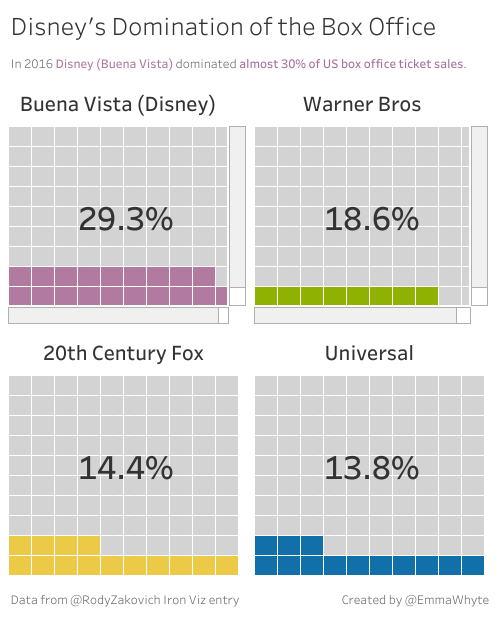
In the end I came up with the viz below when I was trying to learn a new chart type.
Requirements
Your challenge this week is to create some tasty waffle charts! Make sure you follow these rules too:
- My dashboard size is 500 * 620 pixels
- You’ll have to blend the data somehow to create the waffles
- I’m only looking at data from 2016 box office sales
- I’m only looking at the top 4 Distributors (Buena Vista, Warner Bros, Universal and 20th Century Fox)
- Re-create my dashboard exactly (including text and tooltips etc)
Dataset
This week you’ll need two data sources:
Datasource 1 (for making Waffles)
Datasource 2 (all the box office data)
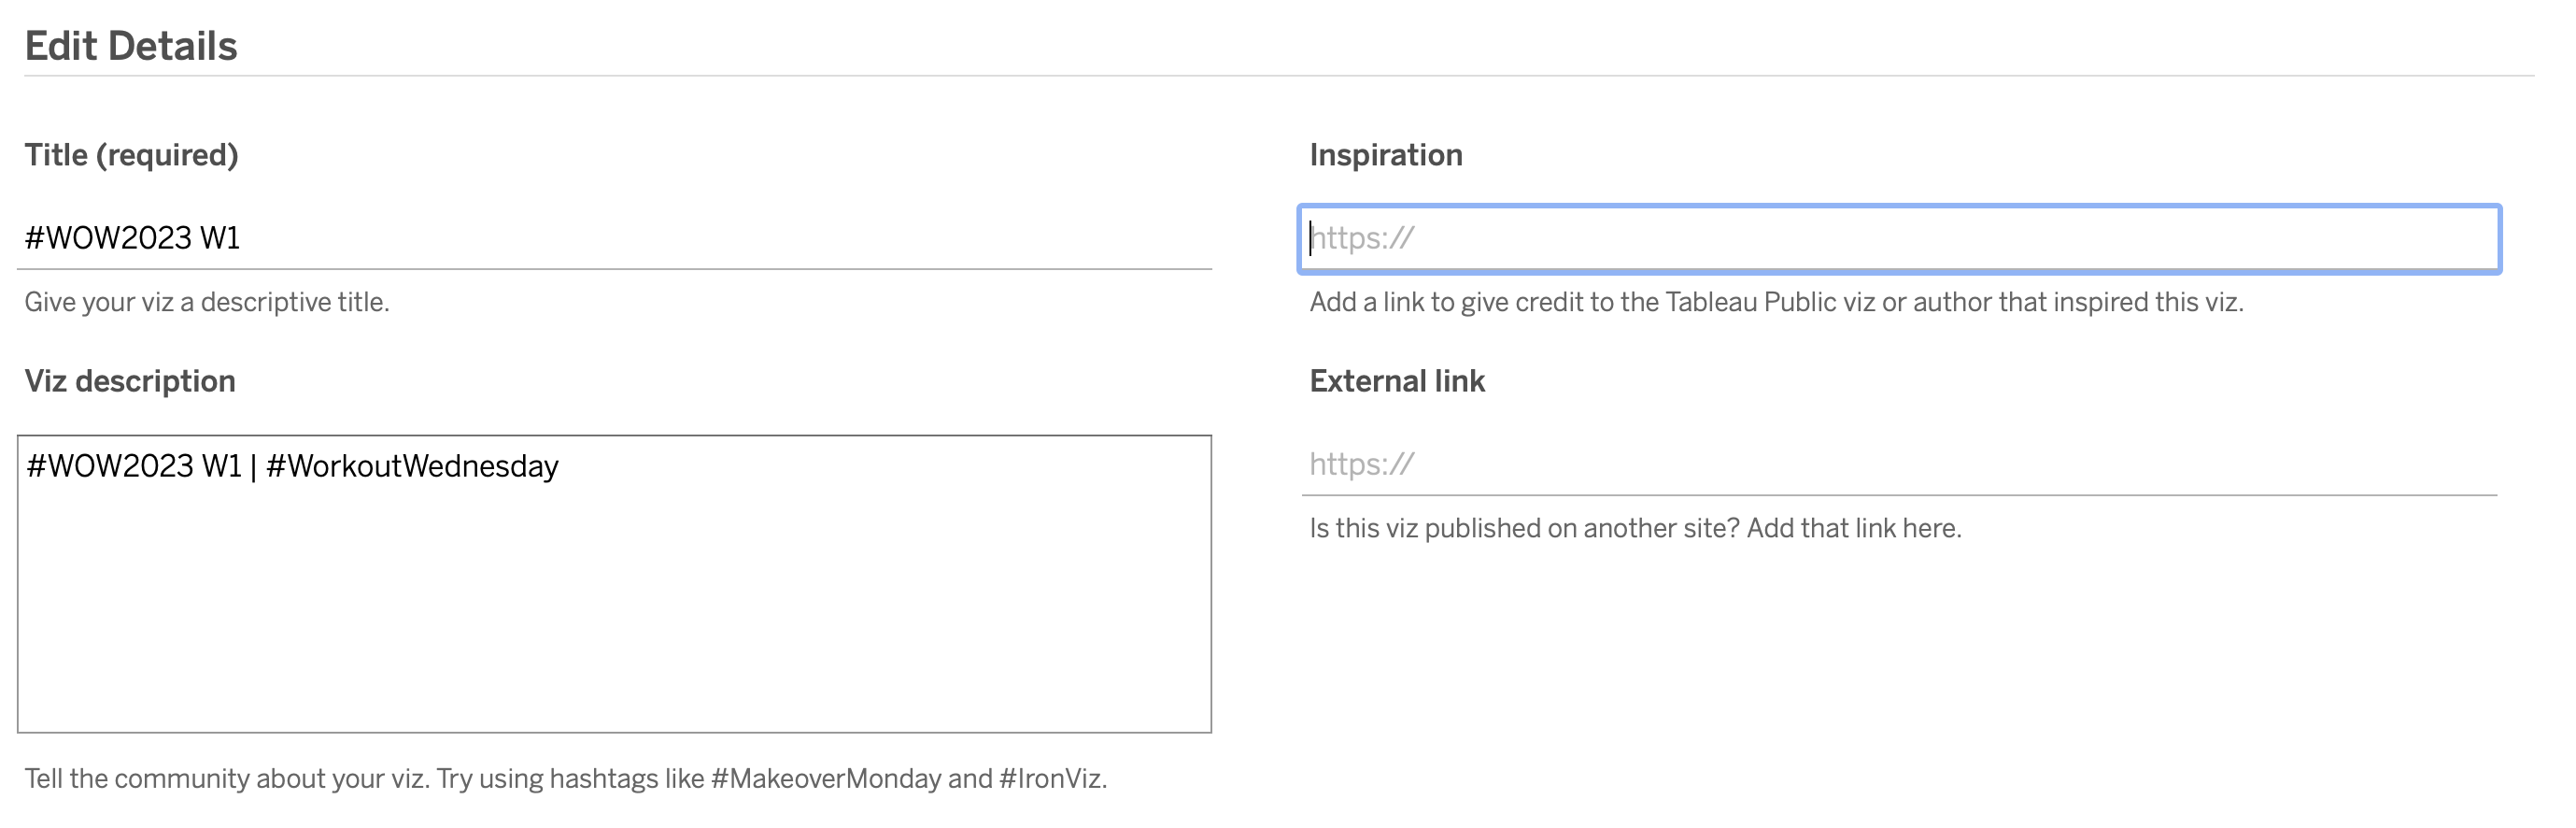
Attribute
When you publish your solution on Tableau Public make sure to take the time and include a link to the original inspiration. Also include the hashtag #WOW2023 in your description to make it searchable!
Share
After you finish your workout, share on Twitter and/or LinkedIn using the hashtag #WOW2023 @Tableau and tag @WorkoutWednsday @EmmaWhyte & @vizwizbi
Solution
Interactive