Introduction
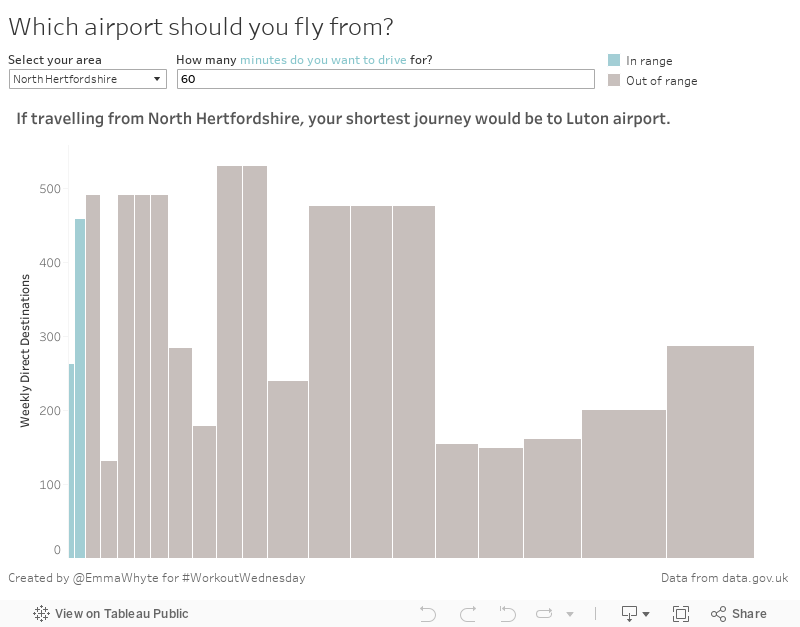
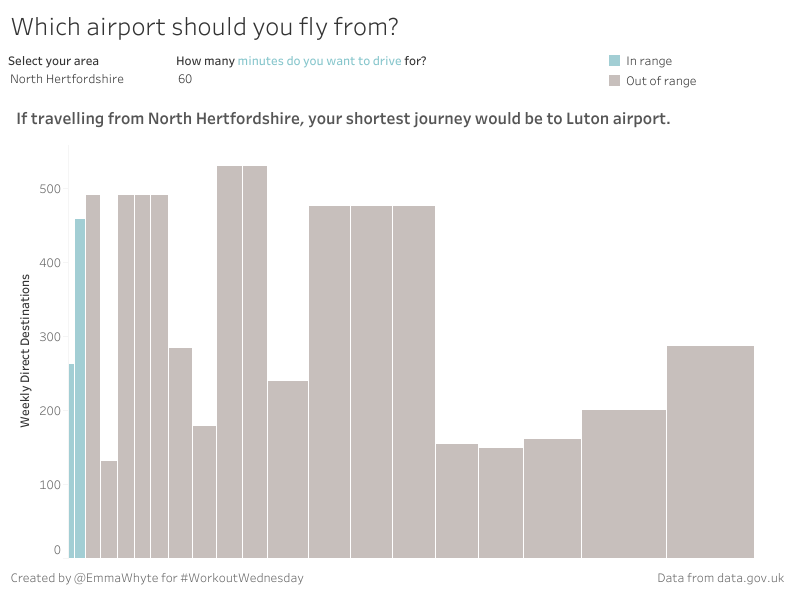
I’m trying out some new chart types in this week’s Workout Wednesday. Recently Tableau introduced the ability to create variable width column charts (sometimes called skyline charts – because they can look like a city skyline). I wanted to get an appropriate and interesting data set for this challenge. I found some data on journey times to UK airports from Lower Super Output Areas from data.gov.uk. Pretty interesting! I supplemented that by joining on lookup tables to aggregate the data up to local authority level – something most people in the UK would recognise as a geography. I also added some additional data about the airports – numbers of passengers and destinations.
Requirements
- My dashboard size is 800*600
- Make sure you match my titles, colours and tooltips
- Enable users to filter down to a specific local authority
- Exclude airports with less than 100 destinations
- The width of each column is the average drive time (for all times of day) to the airport from the selected local authority
- The y axis is the number of weekly direct destinations for the airport
- Colour the bars depending on whether they are in or out of the number of minutes the end user would like to drive for
Dataset
Use this data set
Attribute
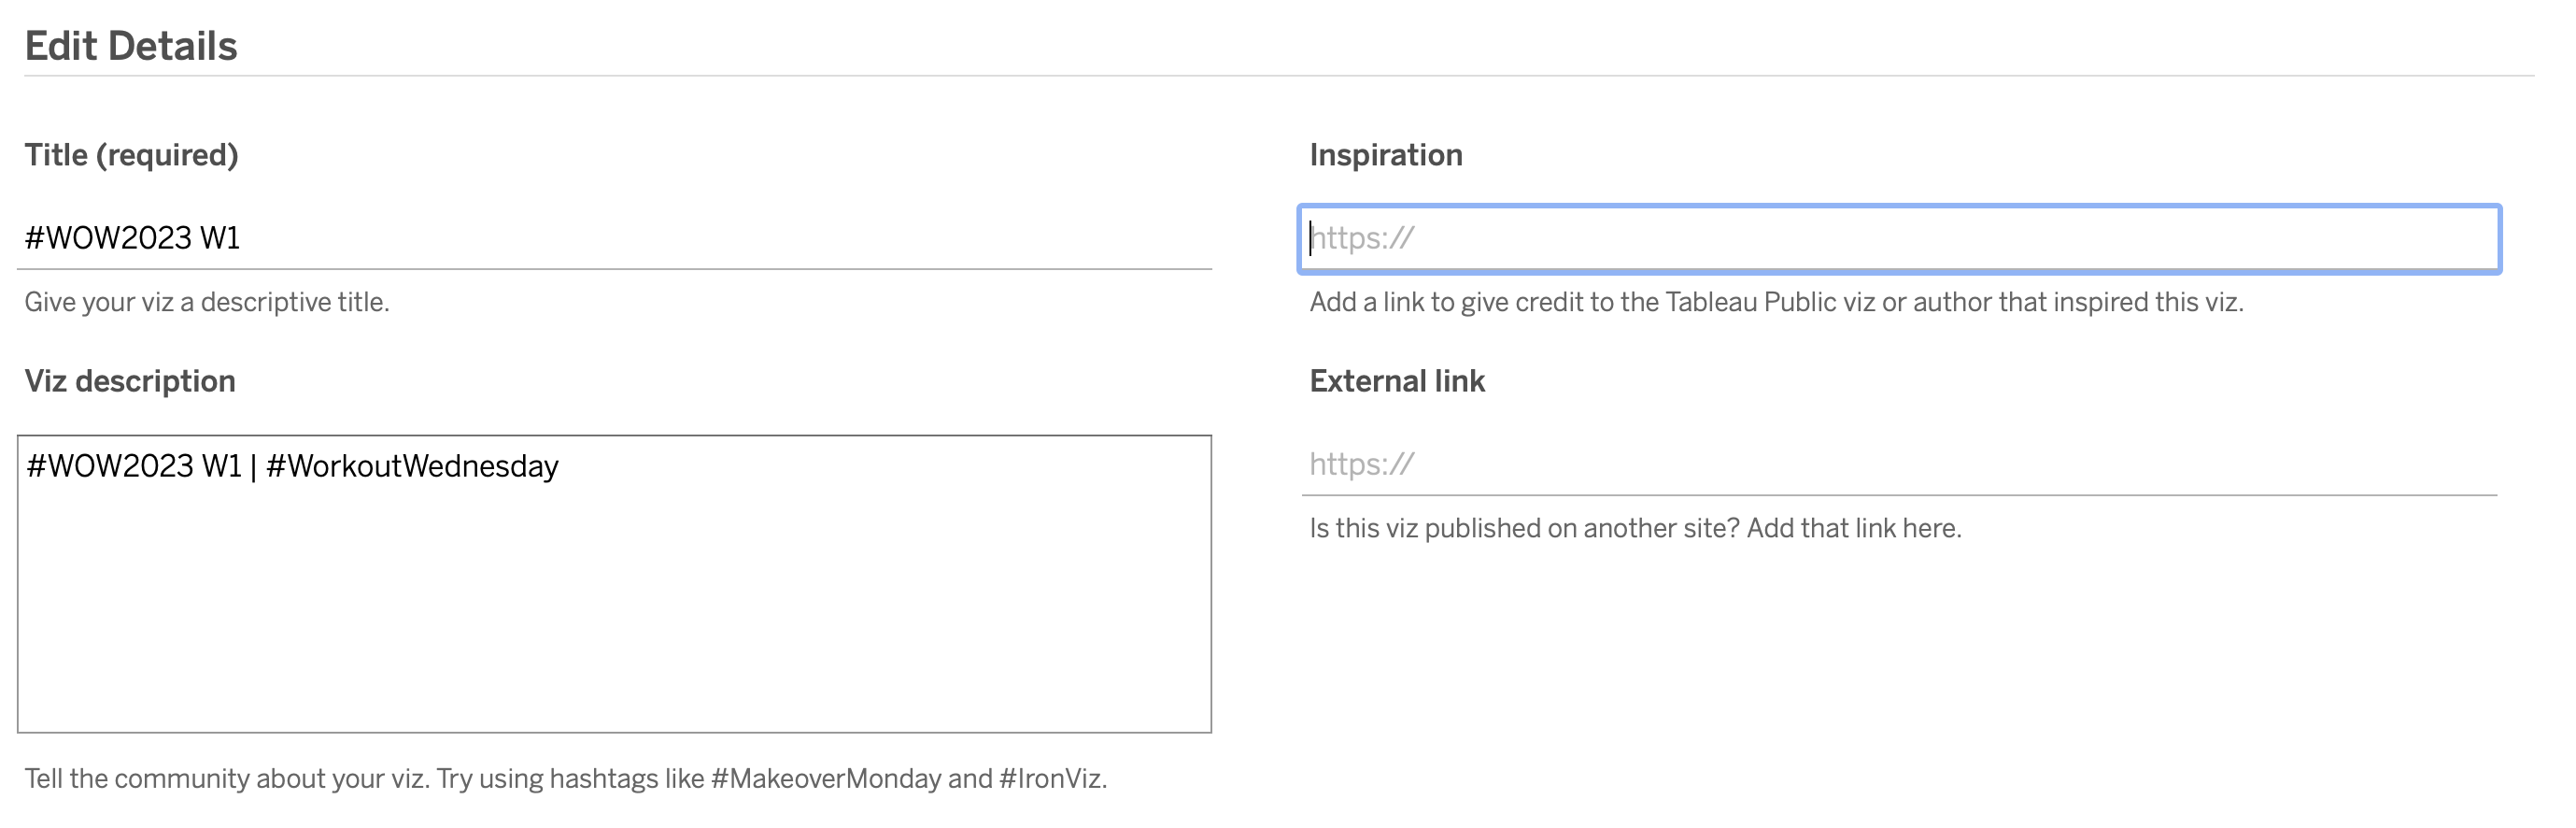
When you publish your solution on Tableau Public make sure to take the time and include a link to the original inspiration. Also include the hashtag #WOW2023 in your description to make it searchable!
Share
After you finish your workout, share on Twitter and/or LinkedIn using the hashtag #WOW2023 @Tableau and tag @WorkoutWednsday @EmmaWhyte & @vizwizbi
Solution
Interactive