#WOW2017 | 42 | Market Basket

Introduction

EDITOR’S NOTE: This challenge was originally published on Emma Whyte’s Tableau blog which no longer exists. This challenge is republished here with the author’s permissions
 

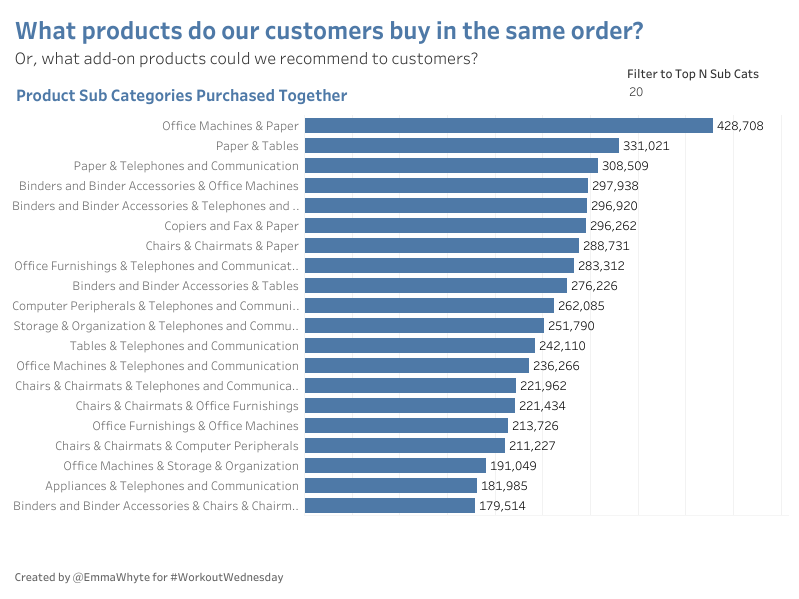
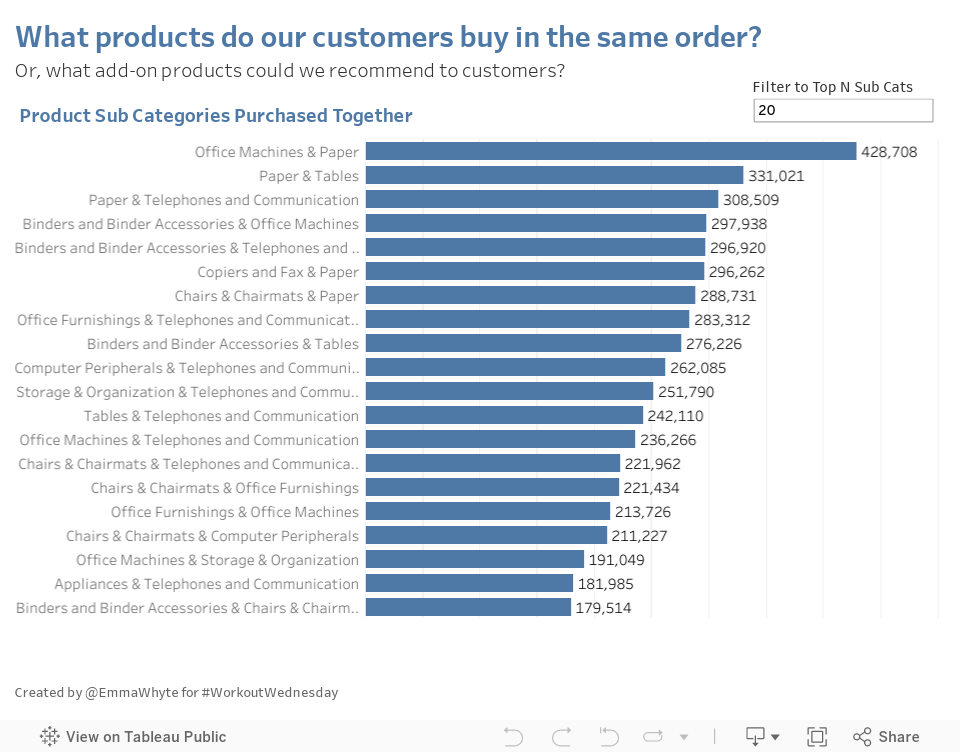
This week’s #WorkoutWednesday requires you to create a Market Basket analysis in Tableau. It’s a common ask, particularly in certain industries like retail. While the visualisation itself might not be that tricky this week, some data prep is going to be required.

Market Basket analysis is often used with online retailers – enabling them to make those suggestions of what else you might be interested in purchasing.

Requirements

For this weeks task you’ll need to use a Windows machine and use the Excel legacy connector to do this task. If you’re on a mac you won’t be able to do the join required (unless you have Windows on Parallels of course).
 
This week you’ll need to:
 
  • get acquainted with self joins (joining the same datasource to itself)
  • join the Superstore data to itself based on Order ID and where product sub categories are different
  • create the visualisation above matching mine exactly
  • create a total sales calculation (sales of both product sub categories when bought together)
  • sort the bars by highest total sales first
  • create a top n filter to show the top n product sub categories based on total sales

Dataset

Use the most recent version of Superstore otherwise download the data.

Attribute

When you publish your solution on Tableau Public make sure to take the time and include a link to the original inspiration.  Also include the hashtag #WOW2023 in your description to make it searchable!

Share

After you finish your workout, share on Twitter and/or LinkedIn using the hashtag #WOW2023 @Tableau and tag @WorkoutWednsday @EmmaWhyte & @vizwizbi


Solution

Interactive

Scroll to Top