Introduction
EDITOR’S NOTE: This challenge was originally published on Emma Whyte’s Tableau blog which no longer exists. This challenge is republished here with the author’s permissions
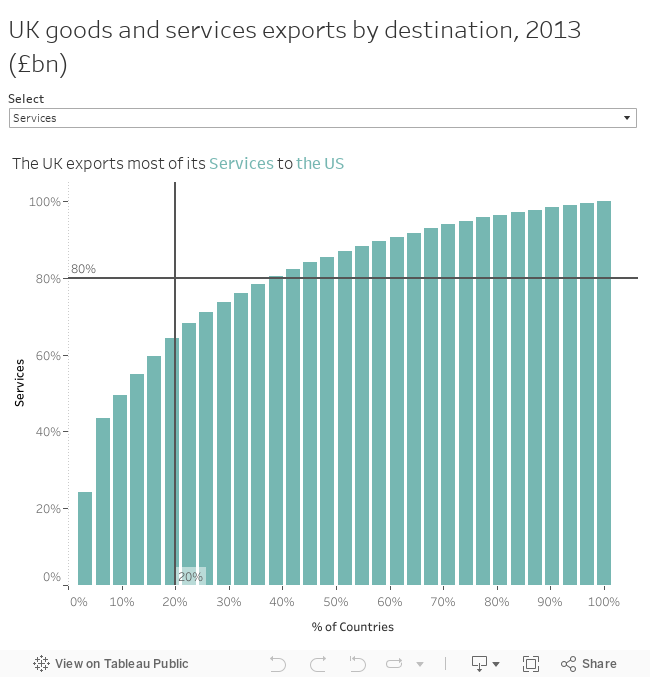
I recently saw this post from Ben Jones on simple ways of transforming tables of data in to multiple vizzes. The blog itself is a great insight in to the thought processes behind choosing a chart type for a data set and all the different ways to visualise the same set of data. The data set that Ben put together relates to exports of goods and services from the UK in 2013. I thought a better way of visualising this data would be in a Pareto chart.
I picked the Pareto because I wanted to know if most of the UKs exports went to only a few countries, rather than a big range. Pareto’s principle suggests that 80% of the effect comes from 20% of causes. It turns out the UK export of goods and services does not abide by this principle. Which is a good thing really.
I picked the Pareto because I wanted to know if most of the UKs exports went to only a few countries, rather than a big range. Pareto’s principle suggests that 80% of the effect comes from 20% of causes. It turns out the UK export of goods and services does not abide by this principle. Which is a good thing really.
Requirements
So this week’s Workout Wednesday challenge is to recreate the dashboard above. Here are a few pointers:
- The x axis indicates the percentage of countries that contribute
- The y axis indicates the percentage of the running total of either goods, services or goods and services
- Has a parameter to switch between goods, services or goods and services
- The chart title should change to reflect the viz
- Tooltips should match mine
- Chart colours and formatting should match mine (I’ve used Tableau palette colours
Dataset
Data can be downloaded here (use the sheet named ‘Table’). If you need some help on creating the Pareto check out this tutorial.
Attribute
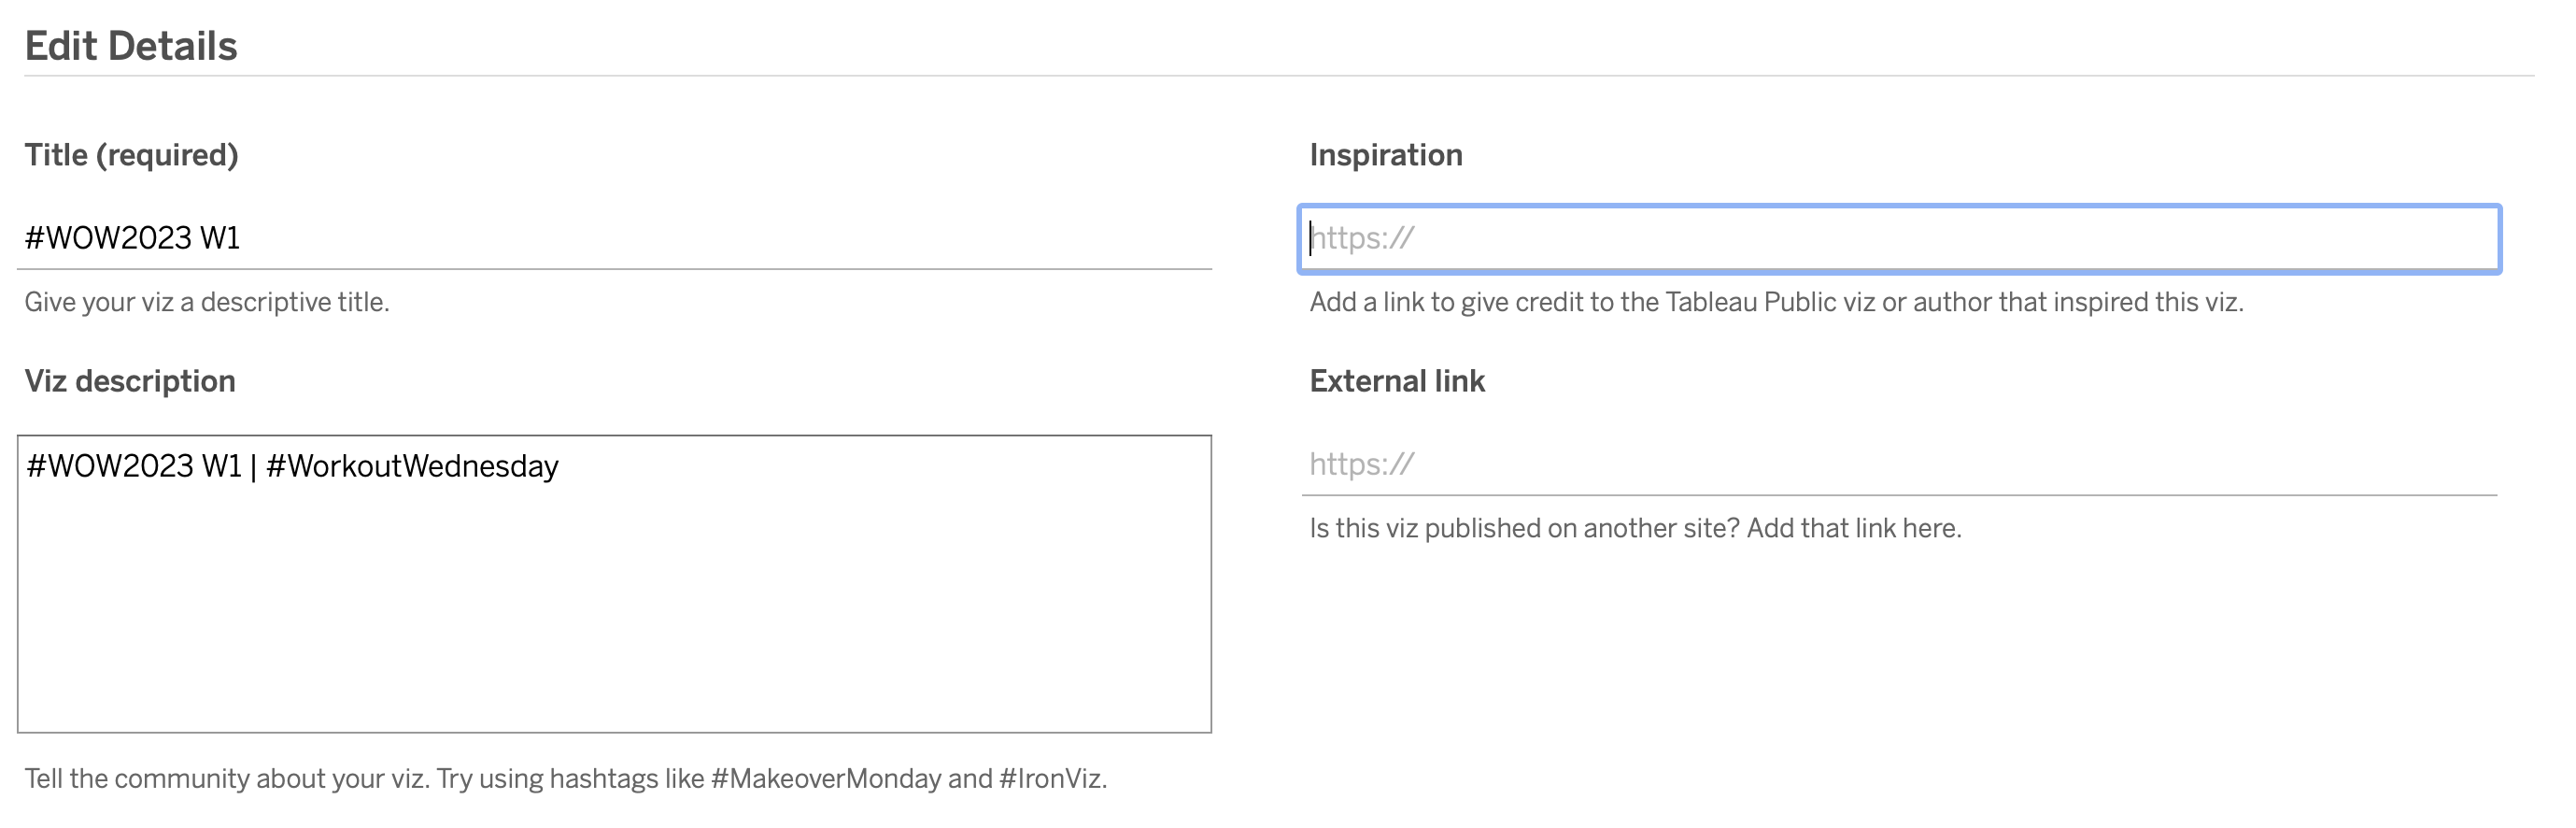
When you publish your solution on Tableau Public make sure to take the time and include a link to the original inspiration. Also include the hashtag #WOW2023 in your description to make it searchable!
Share
After you finish your workout, share on Twitter and/or LinkedIn using the hashtag #WOW2023 @Tableau and tag @WorkoutWednsday @EmmaWhyte & @vizwizbi
Solution
Interactive