#WOW2017 | 18 | Disappearing Vizzes

Introduction

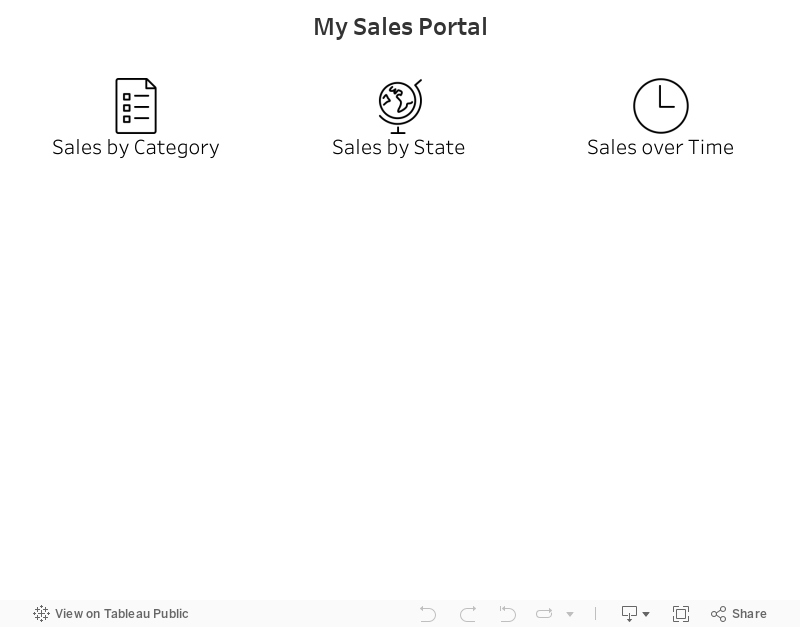
This week’s #WorkoutWednesday takes inspiration from Jamie Coles of The Data School. I asked the current cohort to record some two minute tip videos for me. Jamie came up with a clickable icon to display a different chart on a Tableau dashboard. I’ve adapted this idea slightly so we have a complete clickable menu of icons to display a different viz for each one – without leaving the dashboard you’re on.

Requirements

Your challenge this week is to re-create this. Here are some rules:

  • Each icon in the menu should display the corresponding viz on the dashboard when clicked. When un-selected the viz should disappear.
  • Each viz should look exactly like mine 
  • Dashboard size is 800*600
  • Your tooltips should also match mine
  • On the category chart Profit is on colour
  • On the map Sales is on colour

Dataset

You can download the data here for the challenge.

Attribute

When you publish your solution on Tableau Public make sure to take the time and include a link to the original inspiration.  Also include the hashtag #WOW2023 in your description to make it searchable!

Share

After you finish your workout, share on Twitter and/or LinkedIn using the hashtag #WOW2023 @Tableau and tag @WorkoutWednsday @EmmaWhyte & @vizwizbi


Solution

Interactive

Scroll to Top