#WOW2017 | 22 | Wine Tasting

Introduction

EDITOR’S NOTE: This challenge was originally published on Emma Whyte’s Tableau blog which no longer exists. This challenge is republished here with the author’s permissions
 

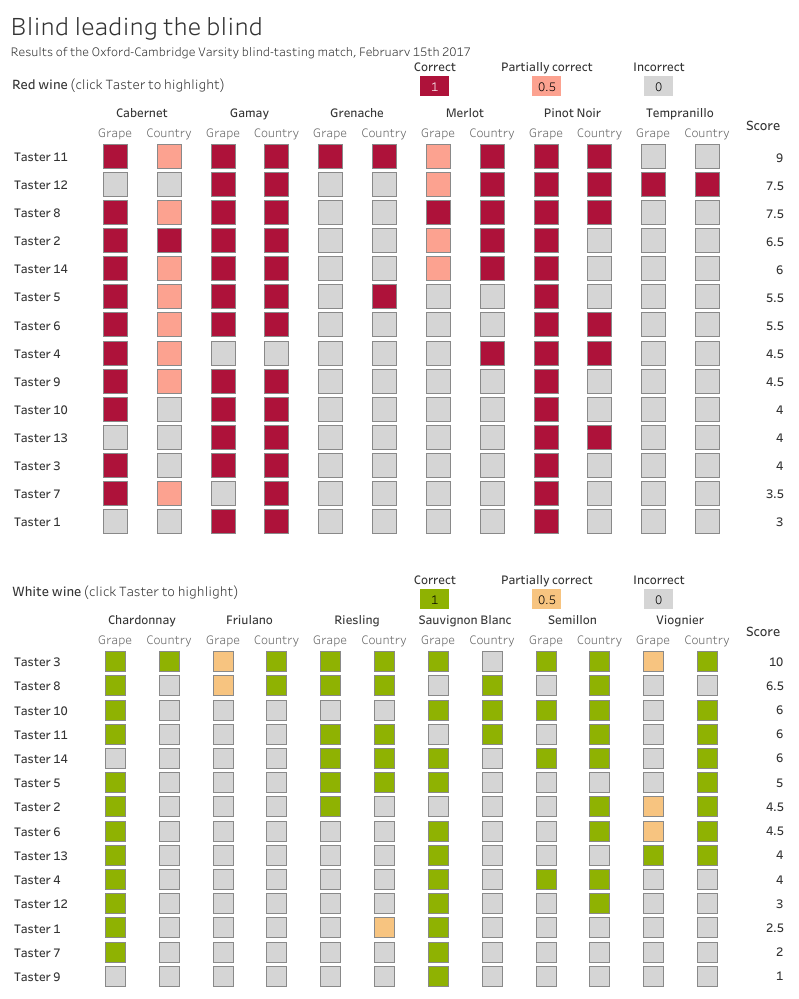
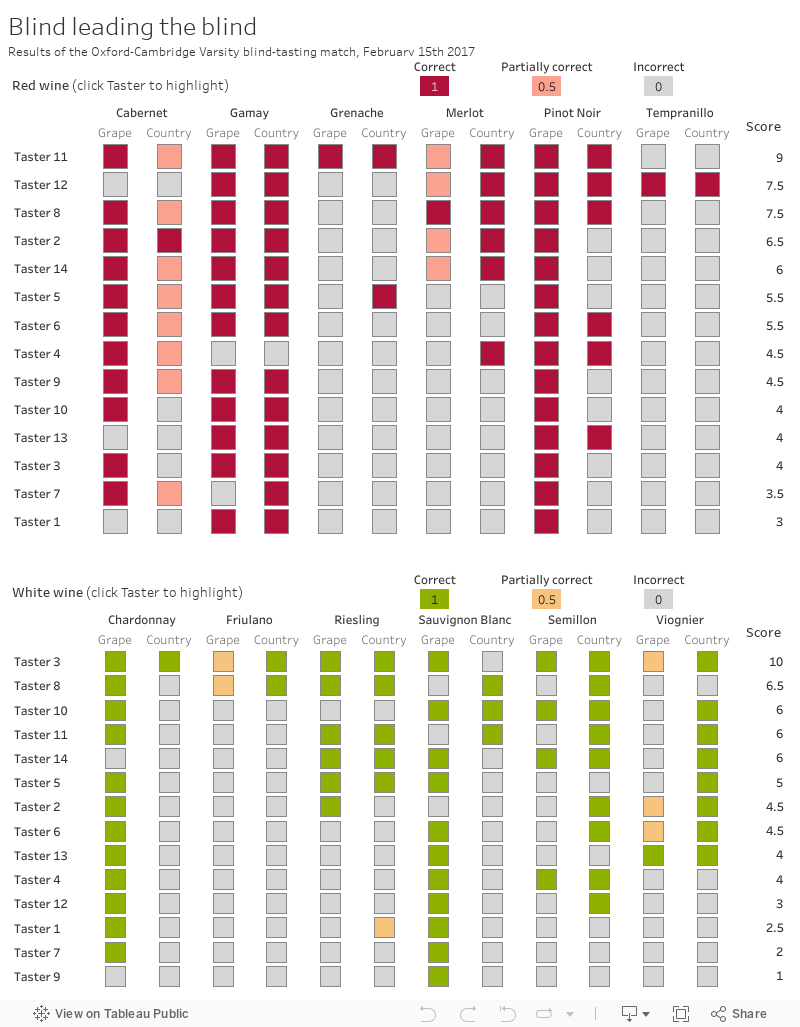
This weeks #WorkoutWednesday is inspired (and probably partly fuelled by) wine. I had this Economist infographic shared with me by a colleague earlier this month. It’s all about the science of wine tasting.

Of course I just had to re-make it in Tableau! The tricky part of the challenge was formatting the scores to show no decimal places when the score was a whole number, to showing to one decimal place when required.

Requirements

Here’s the requirements for this week:
 
  • my dashboard is 800*1000 pixels
  • re-create my dashboard as close as you can get it
  • I’ve used a separate sheet for each of the red and white wine heatmaps and scores
  • The scores should be formatted so when it is a whole number no decimal places are shown. When the score has a half point, it should be shown to 1 decimal place
  • Highlighting the Taster in the reds or whites also highlights them in the other chart

Dataset

Attribute

When you publish your solution on Tableau Public make sure to take the time and include a link to the original inspiration.  Also include the hashtag #WOW2023 in your description to make it searchable!

Share

After you finish your workout, share on Twitter and/or LinkedIn using the hashtag #WOW2023 @Tableau and tag @WorkoutWednsday @EmmaWhyte & @vizwizbi


Solution

Interactive

Scroll to Top