Introduction
I had an interesting question from a customer the other week about creating spine charts in Tableau. I’d never heard of a spine chart before, so first I had to do some research! Turns out spine charts are used frequently in health care and with other public or governmental data.
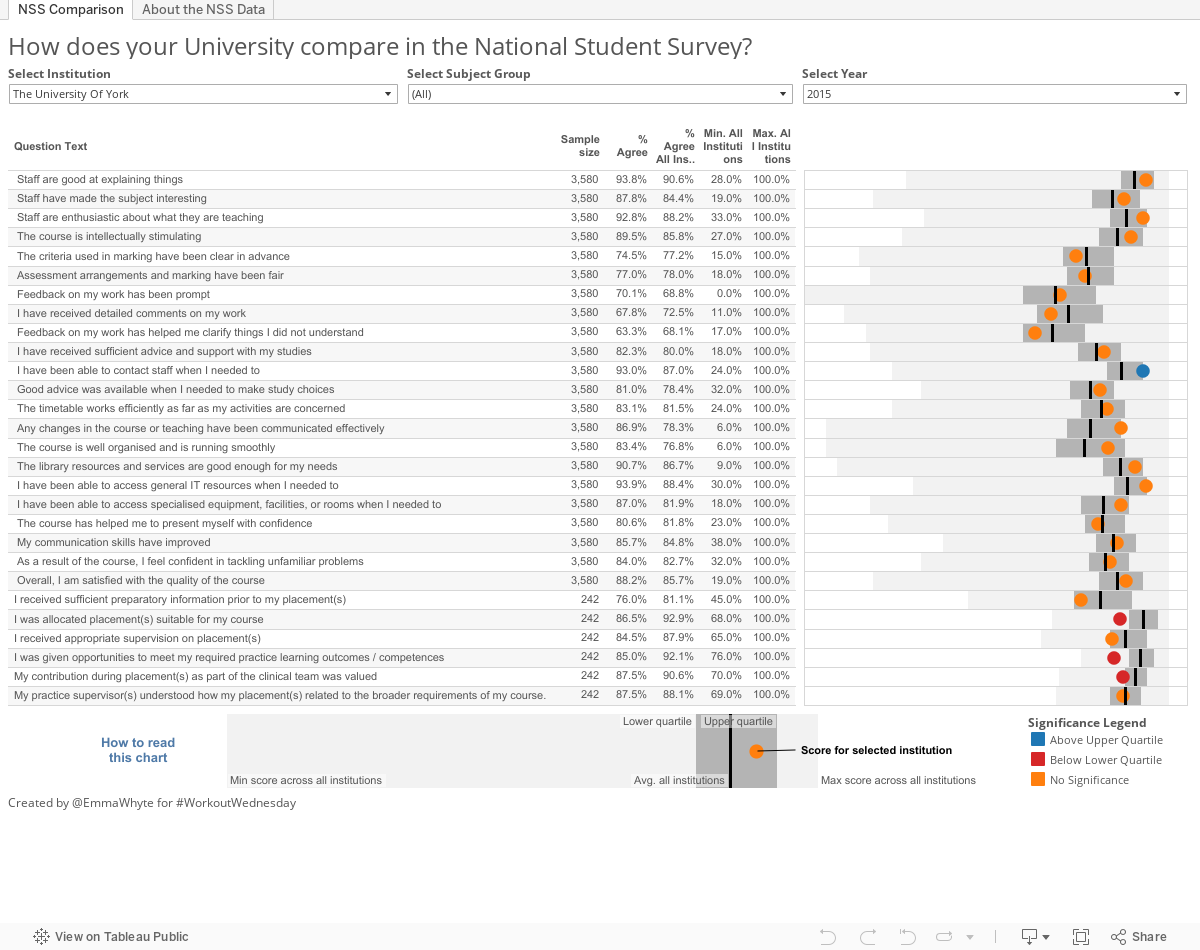
So I created one with the data from the National Student Survey
Requirements
This may look an easy task, but there’s a lot of calculations this week to make up the view. Here’s the checklist:
- Work out the percentage that agree by adding together those that scored 4 and 5
- Show filters for institution, year, and subject grouping
- The data is also filtered to only show questions when the sample size is greater than 30
- For each question show the sample size for the selected institution, the percent that agree of all institutions, the percent that agree for the selected institution and the minimum & maximum percentage for all institutions in the table. You’ll get the question text from the second data source (below). So you’ll have to figure out how to pull them together
- For the spine chart the circle should show the percent agree for the selected institution
- The black line on the spine chart is the percent agree for all institutions
- The darker grey bar on the spine chart is the range between the lower and upper percentiles. (Lower is 0.25 and upper is 0.75)
- The light grey bar on the spine chart shows the range between the minimum and maximum percentage for all institutions
- The circle should be coloured depending on whether it is within the percentile range, or not.
- You should create the spine chart legend too
- Make sure you match my tooltips as well!
Dataset
You can download the data to get started. You will need two files. The results and the questions.
Attribute
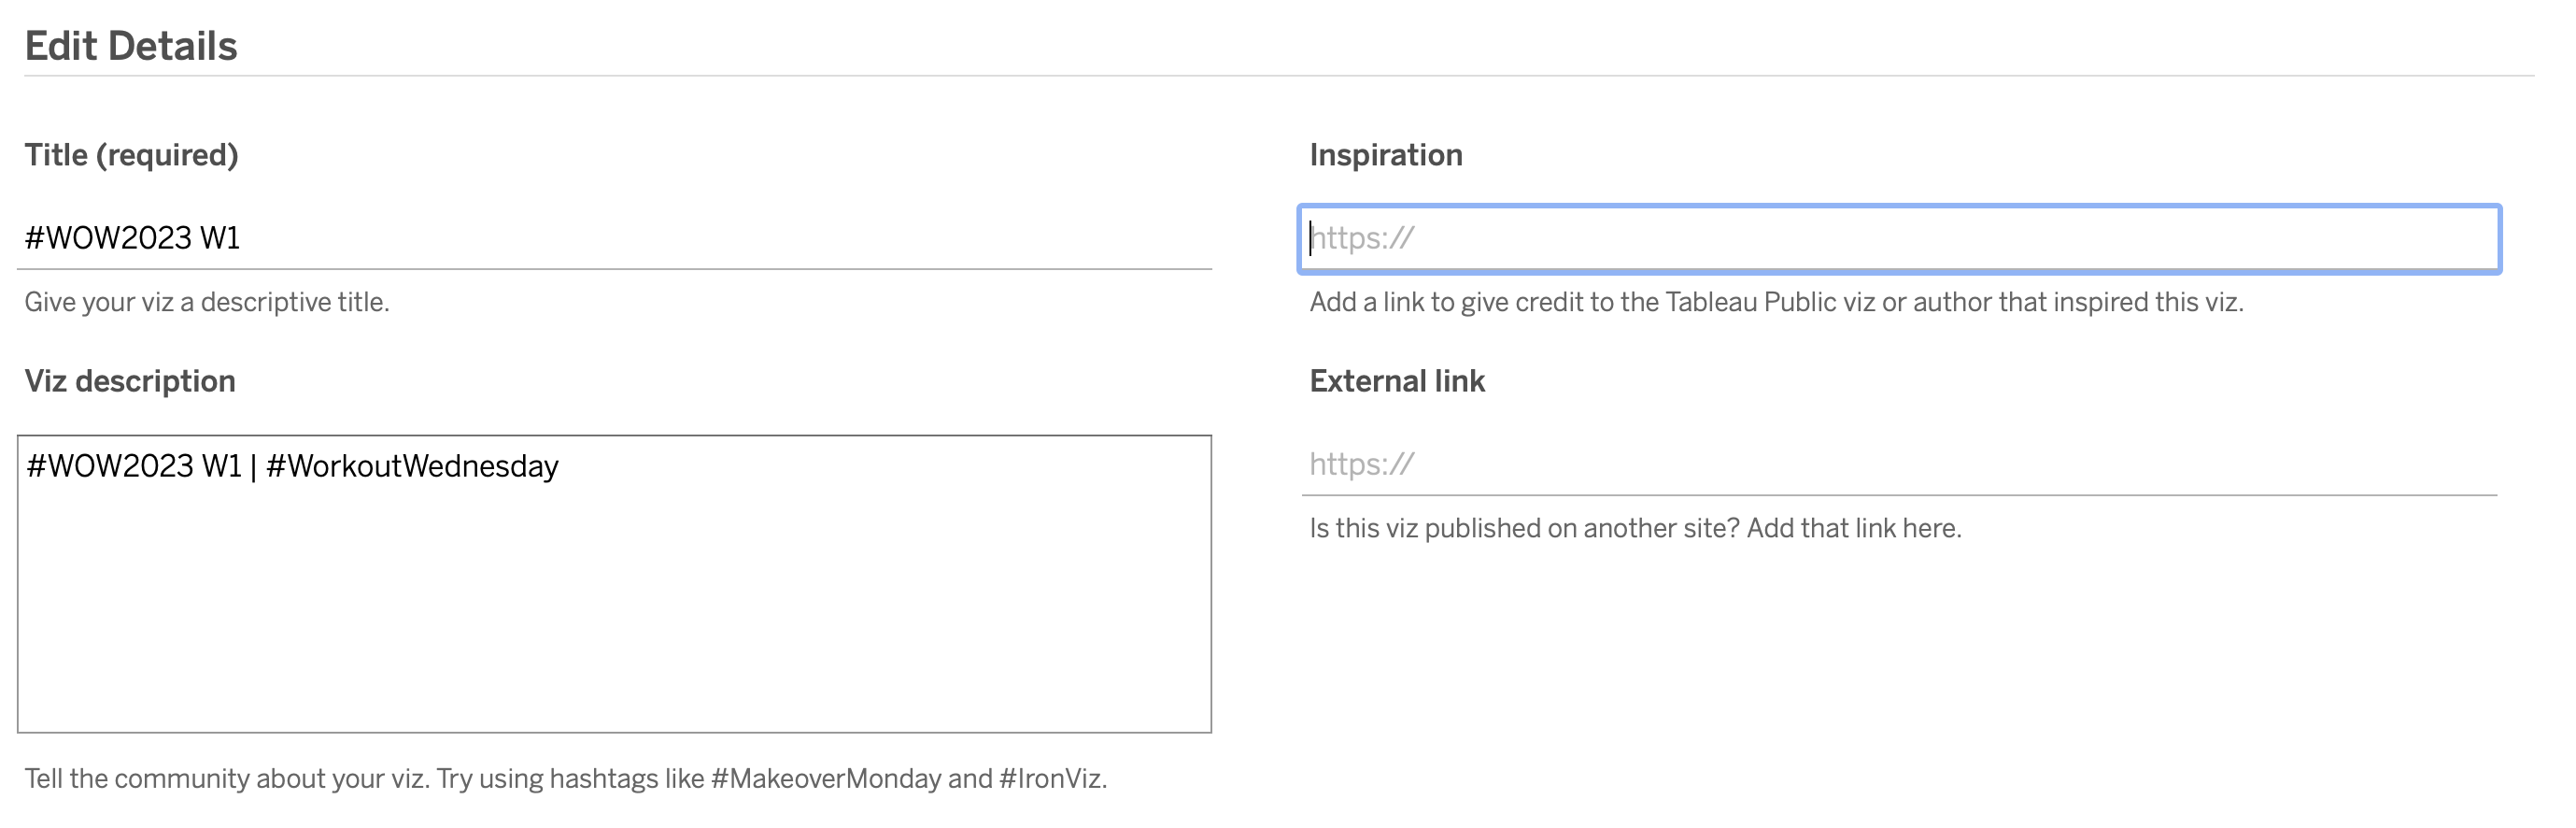
When you publish your solution on Tableau Public make sure to take the time and include a link to the original inspiration. Also include the hashtag #WOW2023 in your description to make it searchable!
Share
After you finish your workout, share on Twitter and/or LinkedIn using the hashtag #WOW2023 @Tableau and tag @WorkoutWednsday @EmmaWhyte & @vizwizbi
Solution
Interactive