Introduction
EDITOR’S NOTE: This challenge was originally published on Emma Whyte’s Tableau blog which no longer exists. This challenge is republished here with the author’s permissions
This week’s #WorkoutWednesday will challenge your Level of Detail calculation knowledge. Don’t be scared, if you’re still new to LODs then I’ve posted some links below to help you out too.
Inspiration for this week came from Dan Watt of The Data School – thanks Dan!
Requirements
This week you’ll need to:
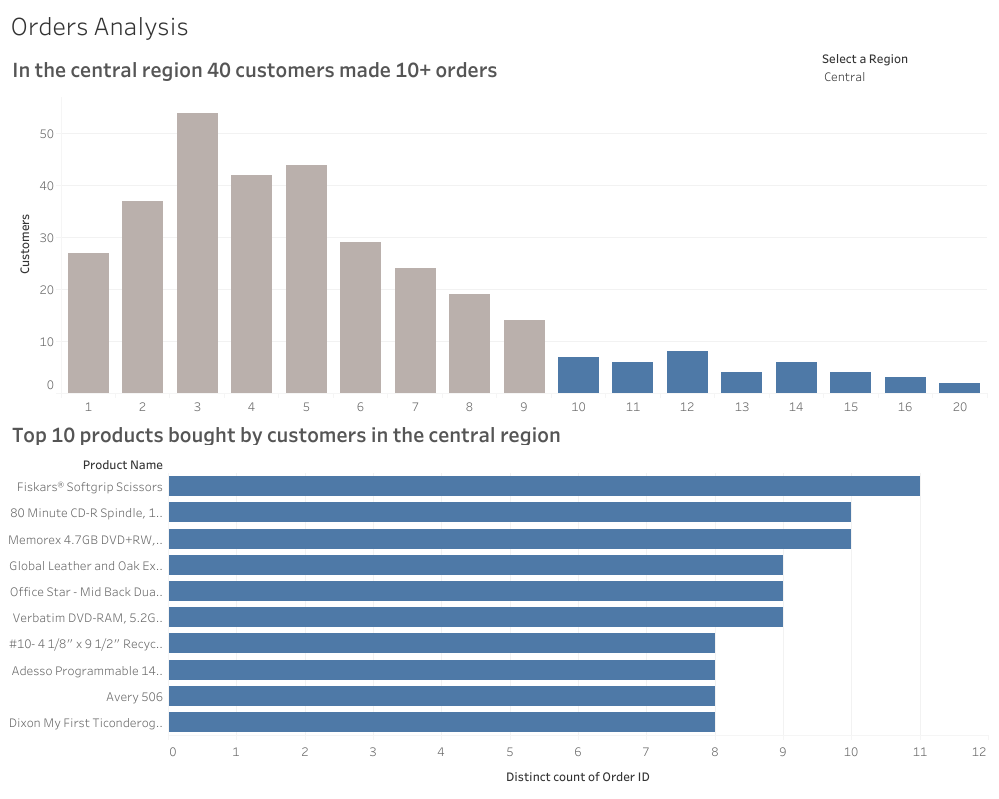
- The first chart should could the number of customers by the number of orders they have made
- The first chart should have its bars coloured blue for 10 orders and above
- The title and tooltip should match as well. The title and tooltip changes as you select a Region
- The bottom chart (Top 10 products) should be filtered by the Region also. The top 10 products should change depending on the Region you select
- When you click on a bar in the top chart it should also filter the top 10 products.
- The title and tooltip on the second chart should also change when you select a Region
Dataset
Use the most recent version of superstore or download the data
Attribute
When you publish your solution on Tableau Public make sure to take the time and include a link to the original inspiration. Also include the hashtag #WOW2023 in your description to make it searchable!

Share
After you finish your workout, share on Twitter and/or LinkedIn using the hashtag #WOW2023 @Tableau and tag @WorkoutWednsday @EmmaWhyte & @vizwizbi


