EDITOR’S NOTE: This challenge was originally published on Emma Whyte’s Tableau blog which no longer exists. This challenge is republished here with the author’s permissions
This week I’ve been having fun with customer cohorts and dashboard actions.
For this #WorkoutWednesday you’ll have to do the following:
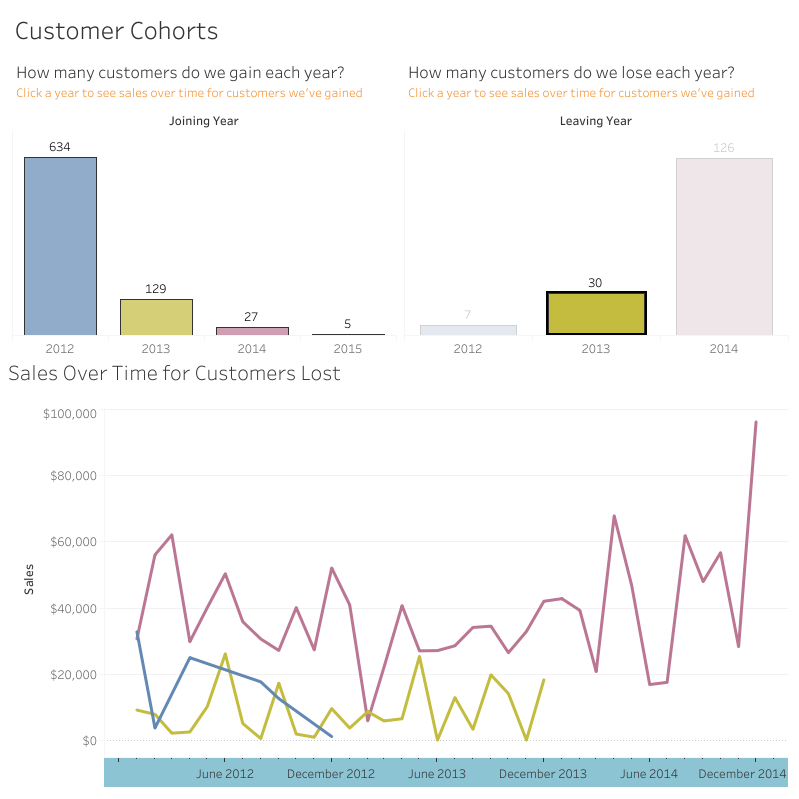
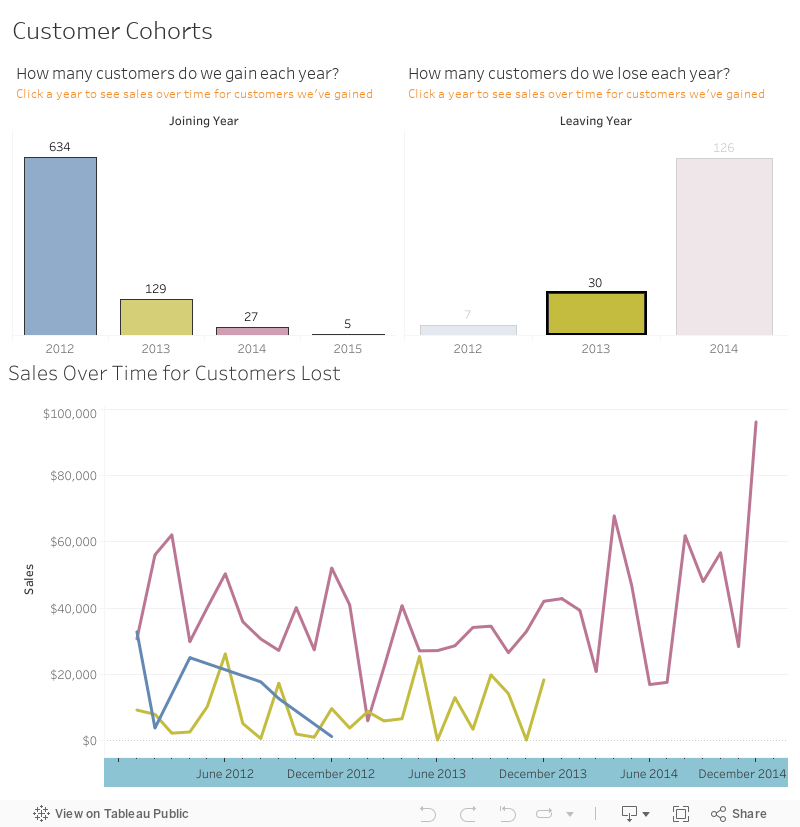
Create a chart to show the number of customers who first purchased from us in each year.
Create a chart to show the number of customers who last purchased from us in each year. If the Customer purchased from us in the last year in the data we have available we should assume they are still a customer of ours.
Create a chart that shows sales over time for customers joined or left, depending on what bar chart you click on. Make sure you test your actions thoroughly to ensure that nothing conflicts.
My dashboard is 800*800 pixels
I’m using the Superfishel Stone colour palette for my years
Make sure you match my titles, tooltips etc.
Dataset
Use the most recent version of Superstore – otherwise download the Superstore Sales data.
Attribute
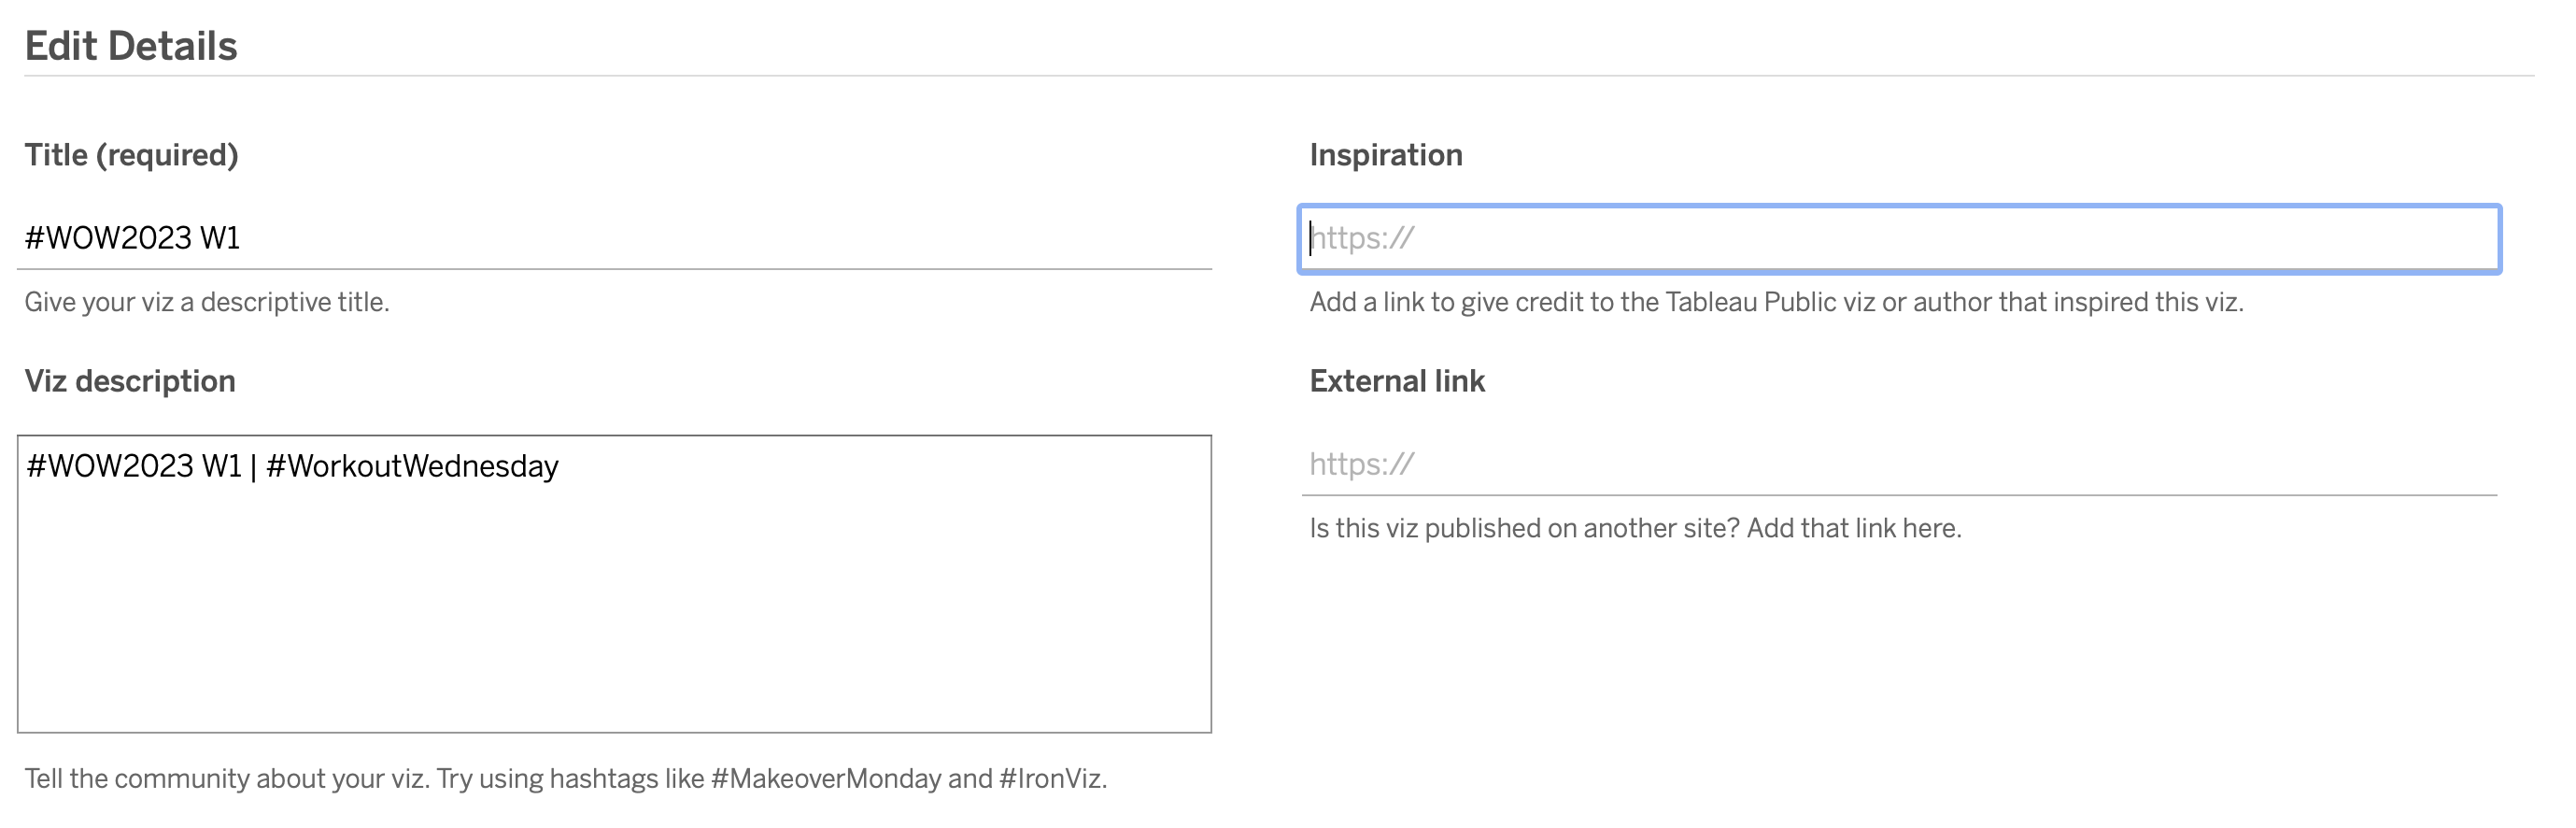
When you publish your solution on Tableau Public make sure to take the time and include a link to the original inspiration. Also include the hashtag #WOW2023 in your description to make it searchable!