#WOW2017 | 48 | Treemap Drilldown

Introduction

EDITOR’S NOTE: This challenge was originally published on Emma Whyte’s Tableau blog which no longer exists. This challenge is republished here with the author’s permissions
 

This weeks #WorkoutWednesday is inspired by a previous workout from Andy Kriebel and a re-imagining from Neil Lord. If you’ve been participating in previous weeks you might find that you’ll use the same tricks from a previous Workout. If you’ve not been participating (where have you been?) you might find it slightly trickier.

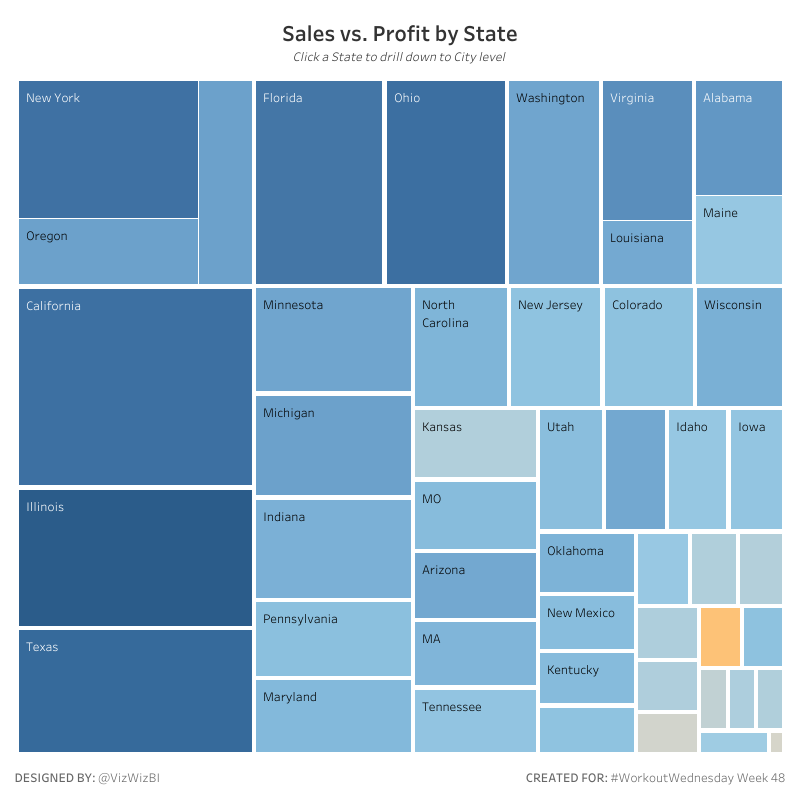
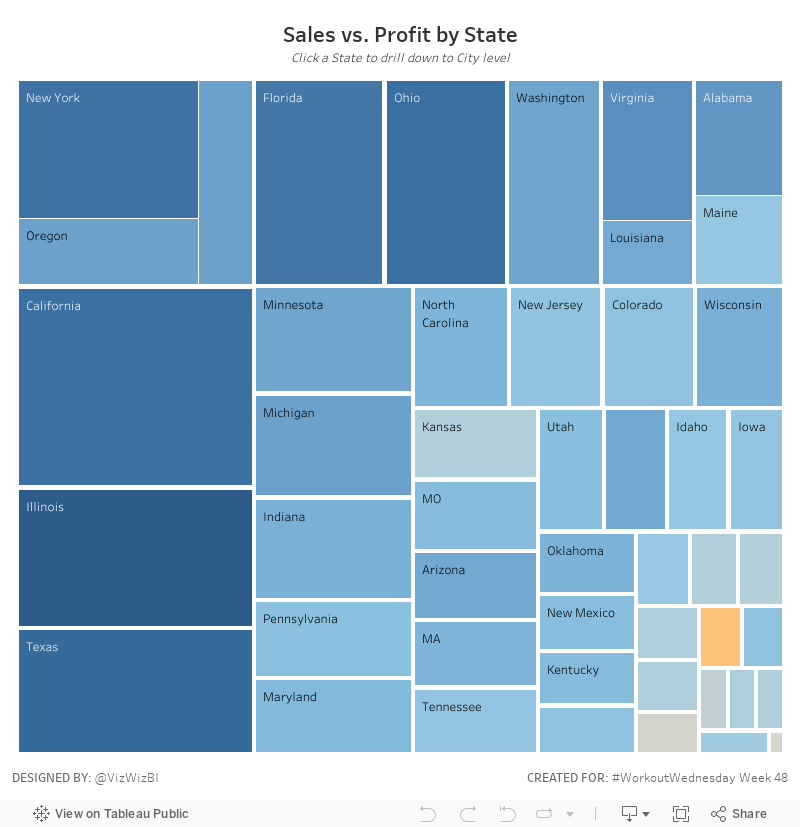
This week we’ll be making a treemap where you can click a segment and drill down in to the next level of the data hierarchy. In this example from state to city. All in the same sheet!

Requirements

Here are the details:
 
  • My dashboard is 800×800 pixels
  • Everything is done in one sheet
  • Clicking a state will display all the cities in that state. Click again to go back up to state.
  • Size your segments by sales and colour by profit
  • Make sure you recreate the title and tooltips (they change depending on where you are in the drilldown)

Dataset

Use the most current version of Superstore. Otherwise download the Superstore Sales data to re-create it exactly.

Attribute

When you publish your solution on Tableau Public make sure to take the time and include a link to the original inspiration.  Also include the hashtag #WOW2023 in your description to make it searchable!

Share

After you finish your workout, share on Twitter and/or LinkedIn using the hashtag #WOW2023 @Tableau and tag @WorkoutWednsday @EmmaWhyte & @vizwizbi


Solution

Interactive

Scroll to Top