Introduction
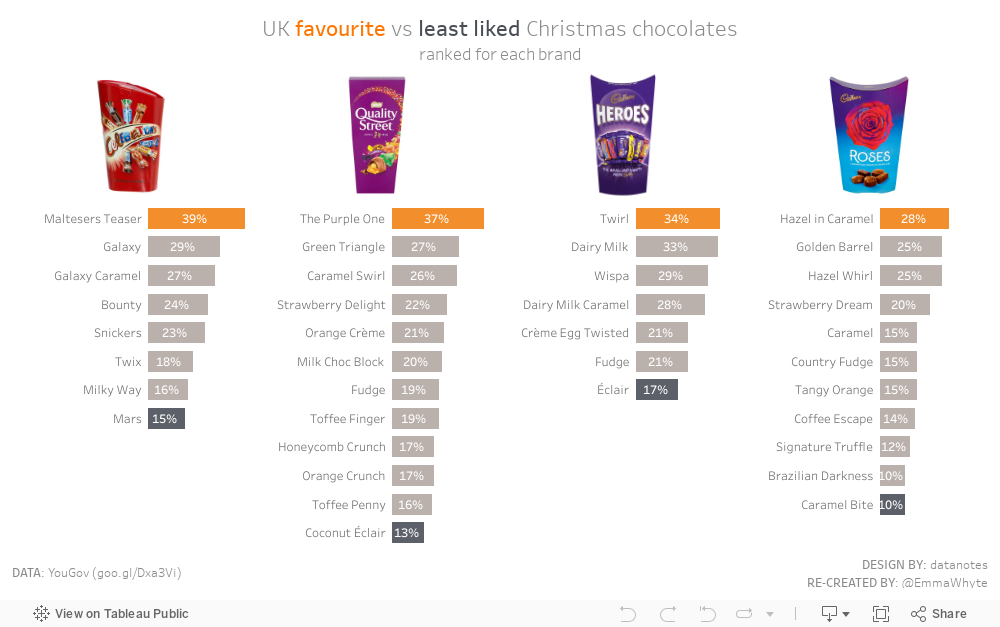
In the UK you’ll find most households celebrating Christmas will have at least one box or tub of chocolate selection boxes. This year my family went for Cadbury Roses (although Celebrations are my favourite).
I spotted this viz of the day on Tableau Public this week. I knew that I had to have a play with the data when I saw it. The data comes from a YouGov poll, but is only downloadable in a PDF format. While Tableau can read PDFs, this one wasn’t formatted very well to work worth. So instead I opted for re-using the data in datanotes dashboard (exported to CSV).
While exporting the data from the workbook, I noticed that the dashboard had been made with 4 sheets. I wondered, ‘could it be done in one?’. This is your challenge this week
Requirements
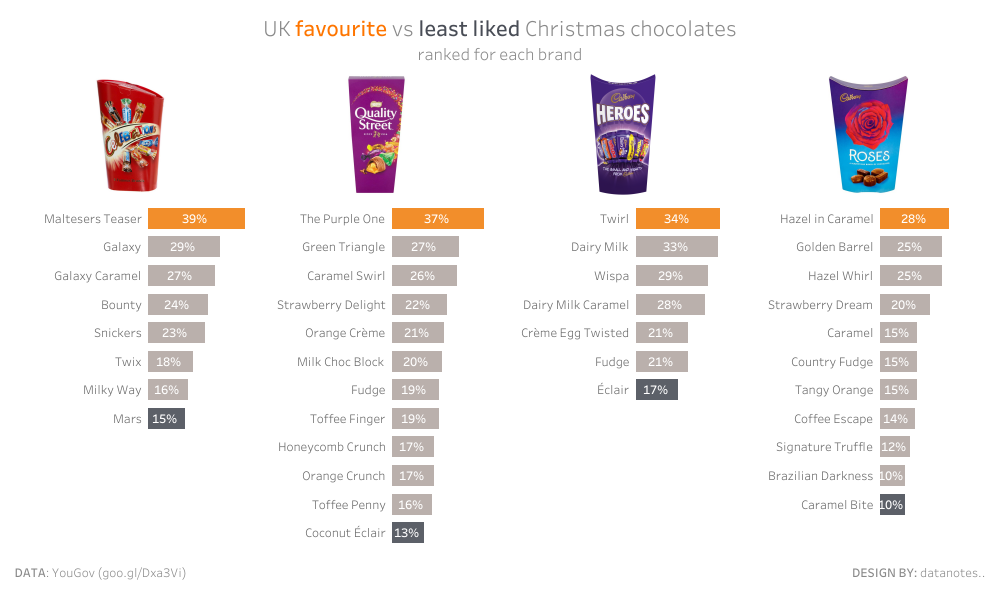
- remake the dashboard below. The bar charts should all be made in one sheet / view.
- my dashboard is 800 * 600
- make sure you copy my colours – the favourite chocolate should be orange, the least favourite dark grey, and the rest light grey. You CANNOT use manual colours based on the chocolate name – it has to be based on the ranking of the chocolates in each brand.
- label the bars with the chocolate name and the percent of people who picked it as their favourite
- decide if Malteasers really is the best Celebration – really we all know it’s Galaxy
- match all the titles, tooltips and labelling exactly
- Image sources: Celebrations, Quality Street, Cadbury Heroes, Cadbury Roses
Dataset
You’ll need to download the data to get started too.
Attribute
When you publish your solution on Tableau Public make sure to take the time and include a link to the original inspiration. Also include the hashtag #WOW2023 in your description to make it searchable!
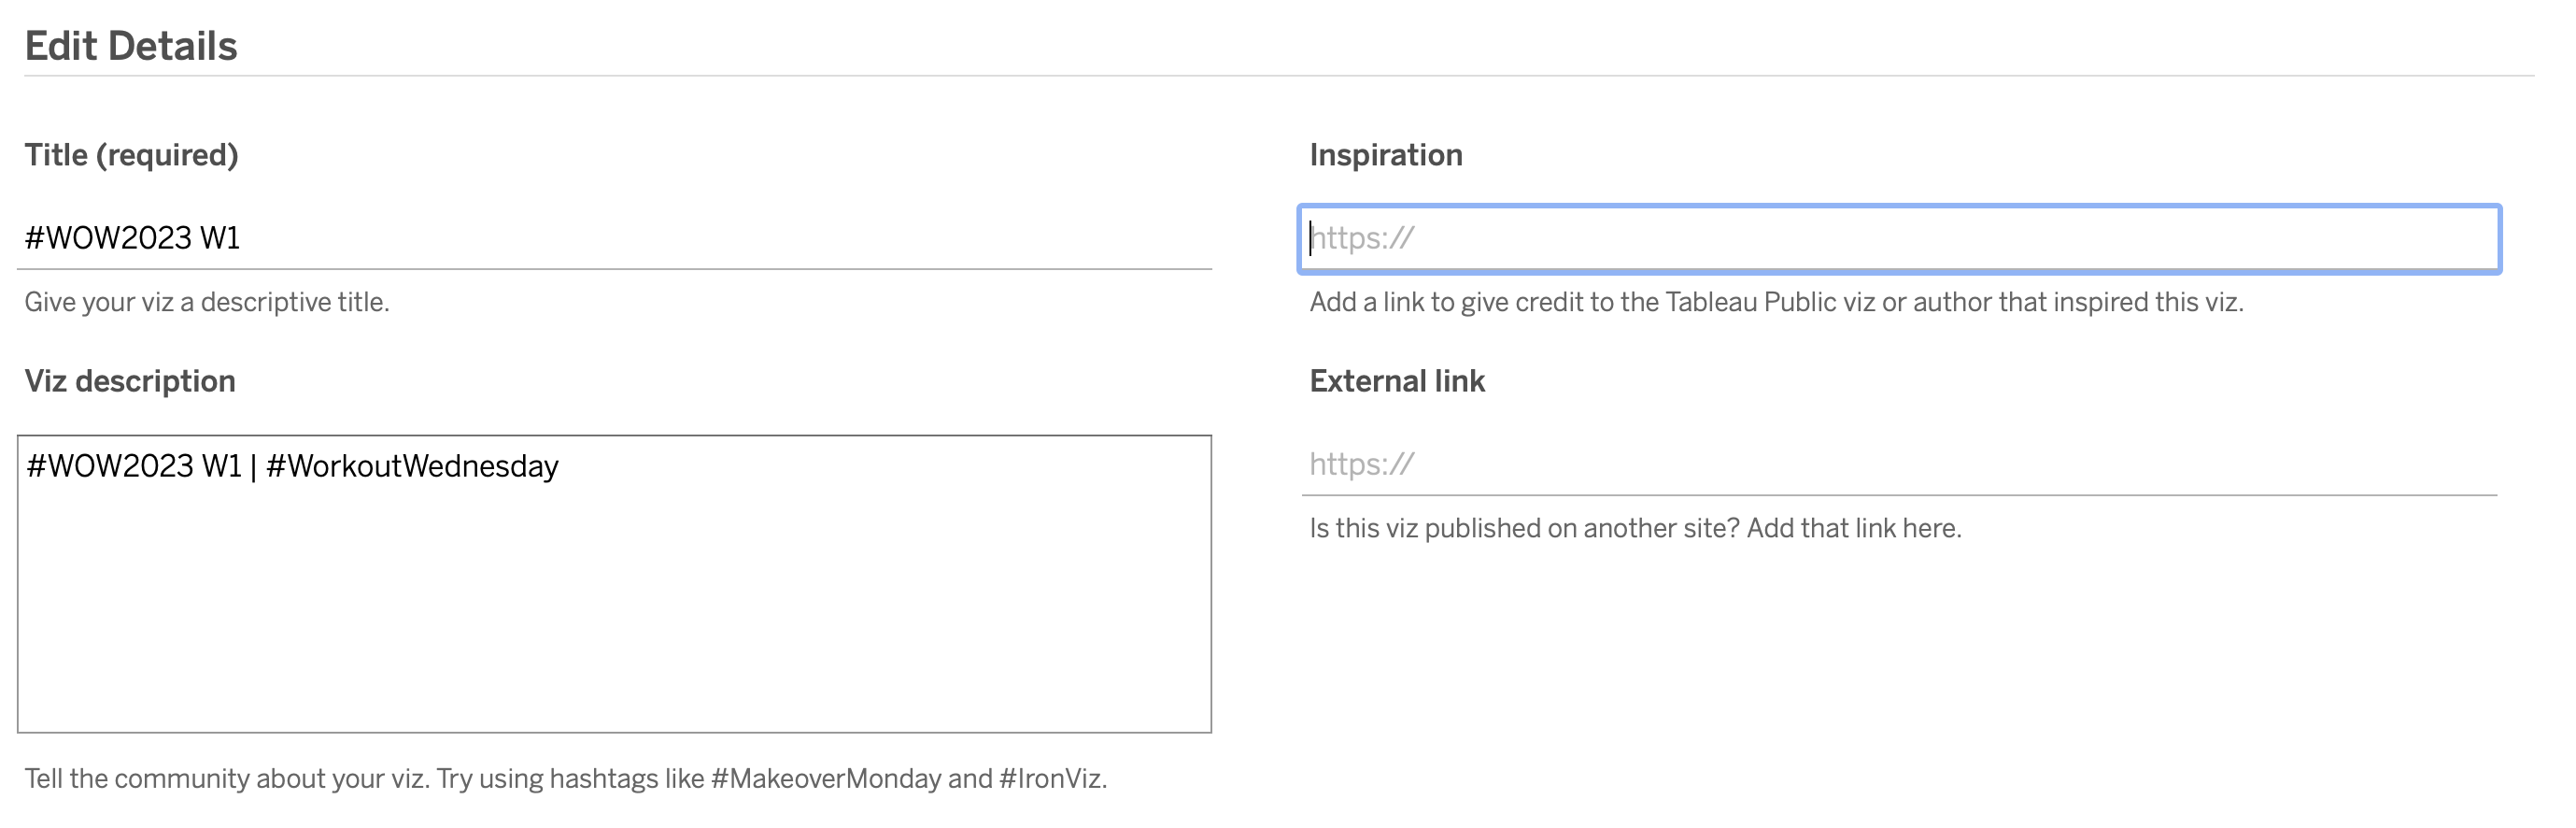
Share
After you finish your workout, share on Twitter and/or LinkedIn using the hashtag #WOW2023 @Tableau and tag @WorkoutWednsday @EmmaWhyte & @vizwizbi
Solution
Interactive