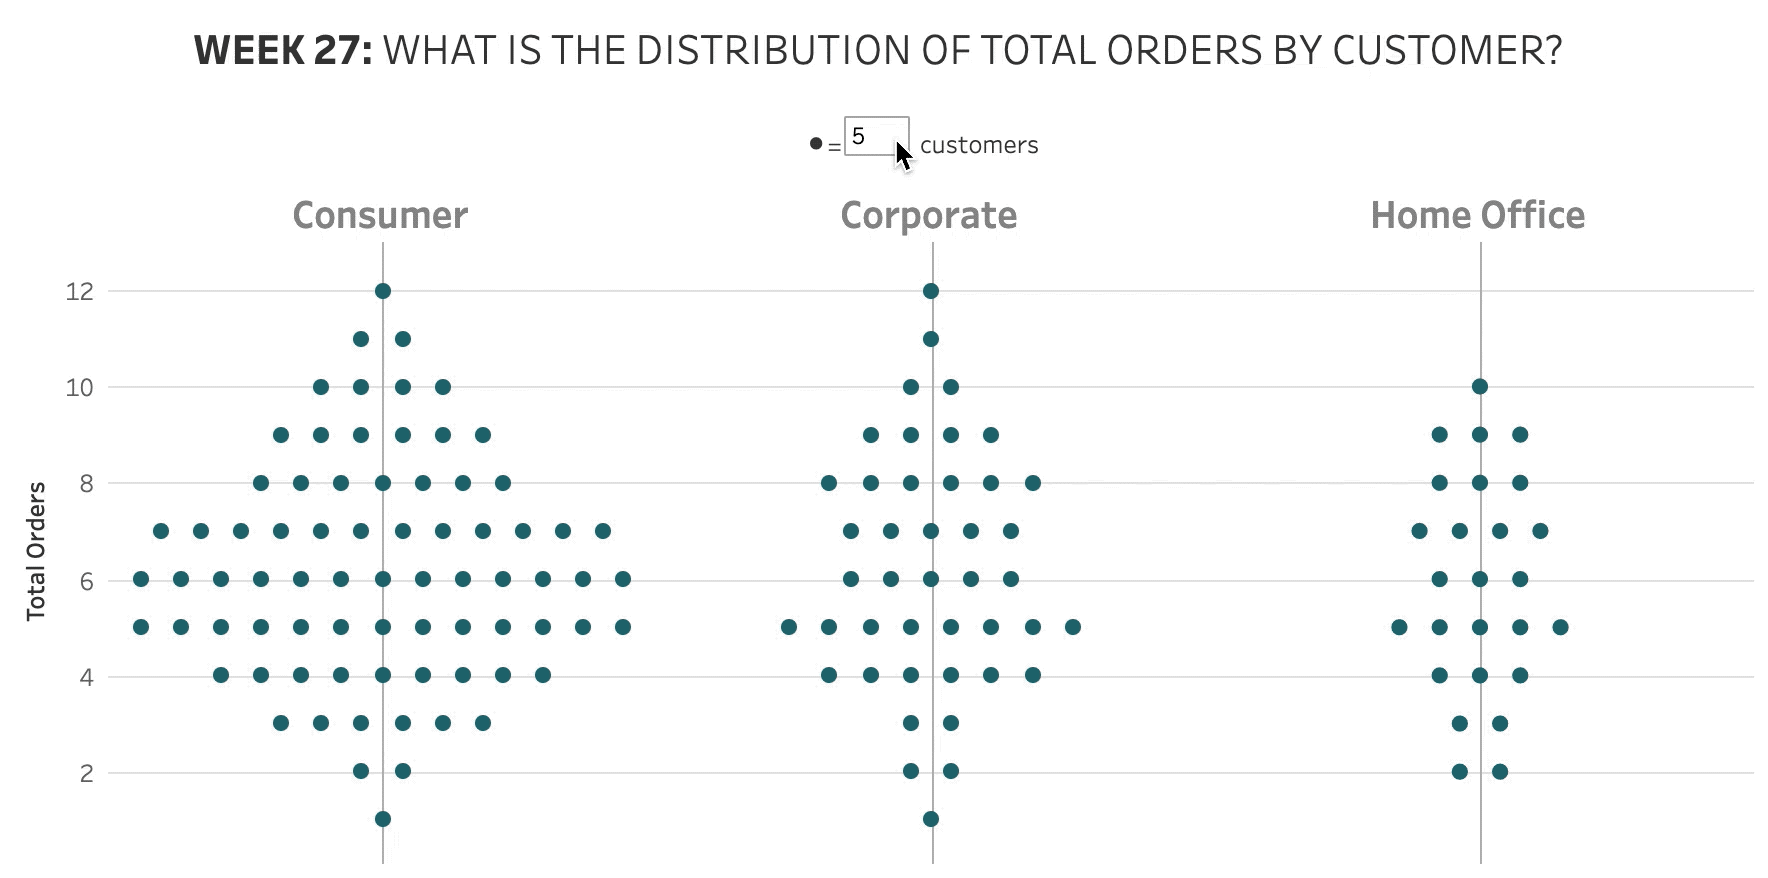
2020 Week 27: What is the distribution of total orders by customer?
Introduction After many weeks of practical challenges. I’ve decided to switch it up this week. If I’m being honest I’ve been saving this challenge since August of last year (it’s still not the oldest challenge I am saving). This weeks challenge is to make a symmetrical dot plot. Not only is the dot plot symmetrical …
2020 Week 27: What is the distribution of total orders by customer? Read More