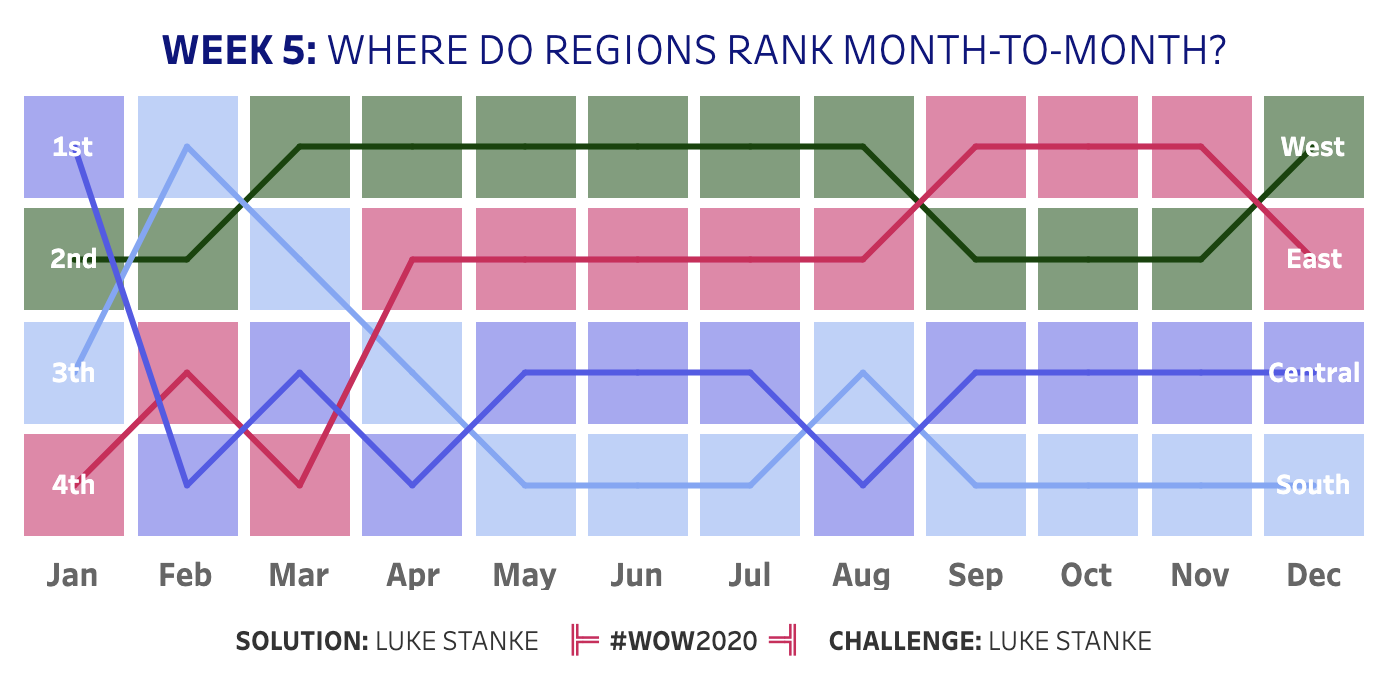
This week I wanted to share a challenge that comes from a chat that I had with Zach Bowders near the beginning of the year. Zach was shared a step-ranking visualization he was putting together and I really thought it was a great iteration of the chart type.
While there have ben step-ranking charts done for #WorkoutWednesday in the past, I thought this one took a unique approach.
I did add my own additional challenges, of course.
Replicate-the step-ranked chart using total sales by region and month.
You may only put one calculation on labels.
Advanced: You may not use the square or shapes mark type.
Dataset
This week uses the superstore dataset for Tableau 2019.4. You can get it here at data.world
Attribute
When you publish your solution on Tableau Public make sure to take the time and include a link to the original inspiration. Also include the hashtag #WOW2020 in your description to make it searchable!

Hi Luke,
some lesson learned even if it looked simple
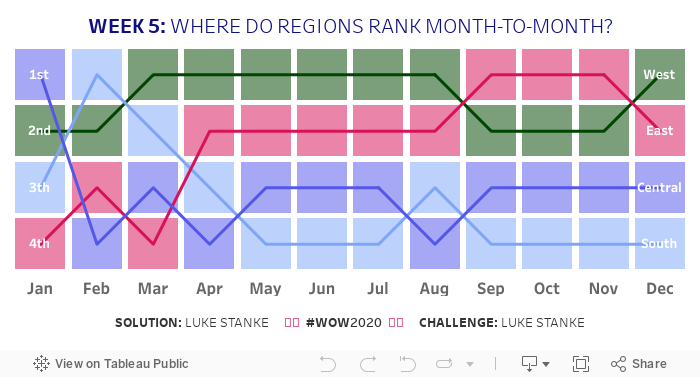
Here’s my shot: http://bit.ly/2020w05