Introduction
At the last North West Tableau User Group, I watched a presentation from Ryan Lowers and Nathan Leather where they looked at using parameters as a data source. You can see their workbook here. So this week we are focusing on using Parameters as a Data Source. How can we add data to the current data we have. The dashboard focuses in on Sales, current, forecasts and targets.
Requirements
- Dashboard Size: 1000px by 500 px
- # of Sheets – up to you
- Create a bar chart that shows 2019 sales
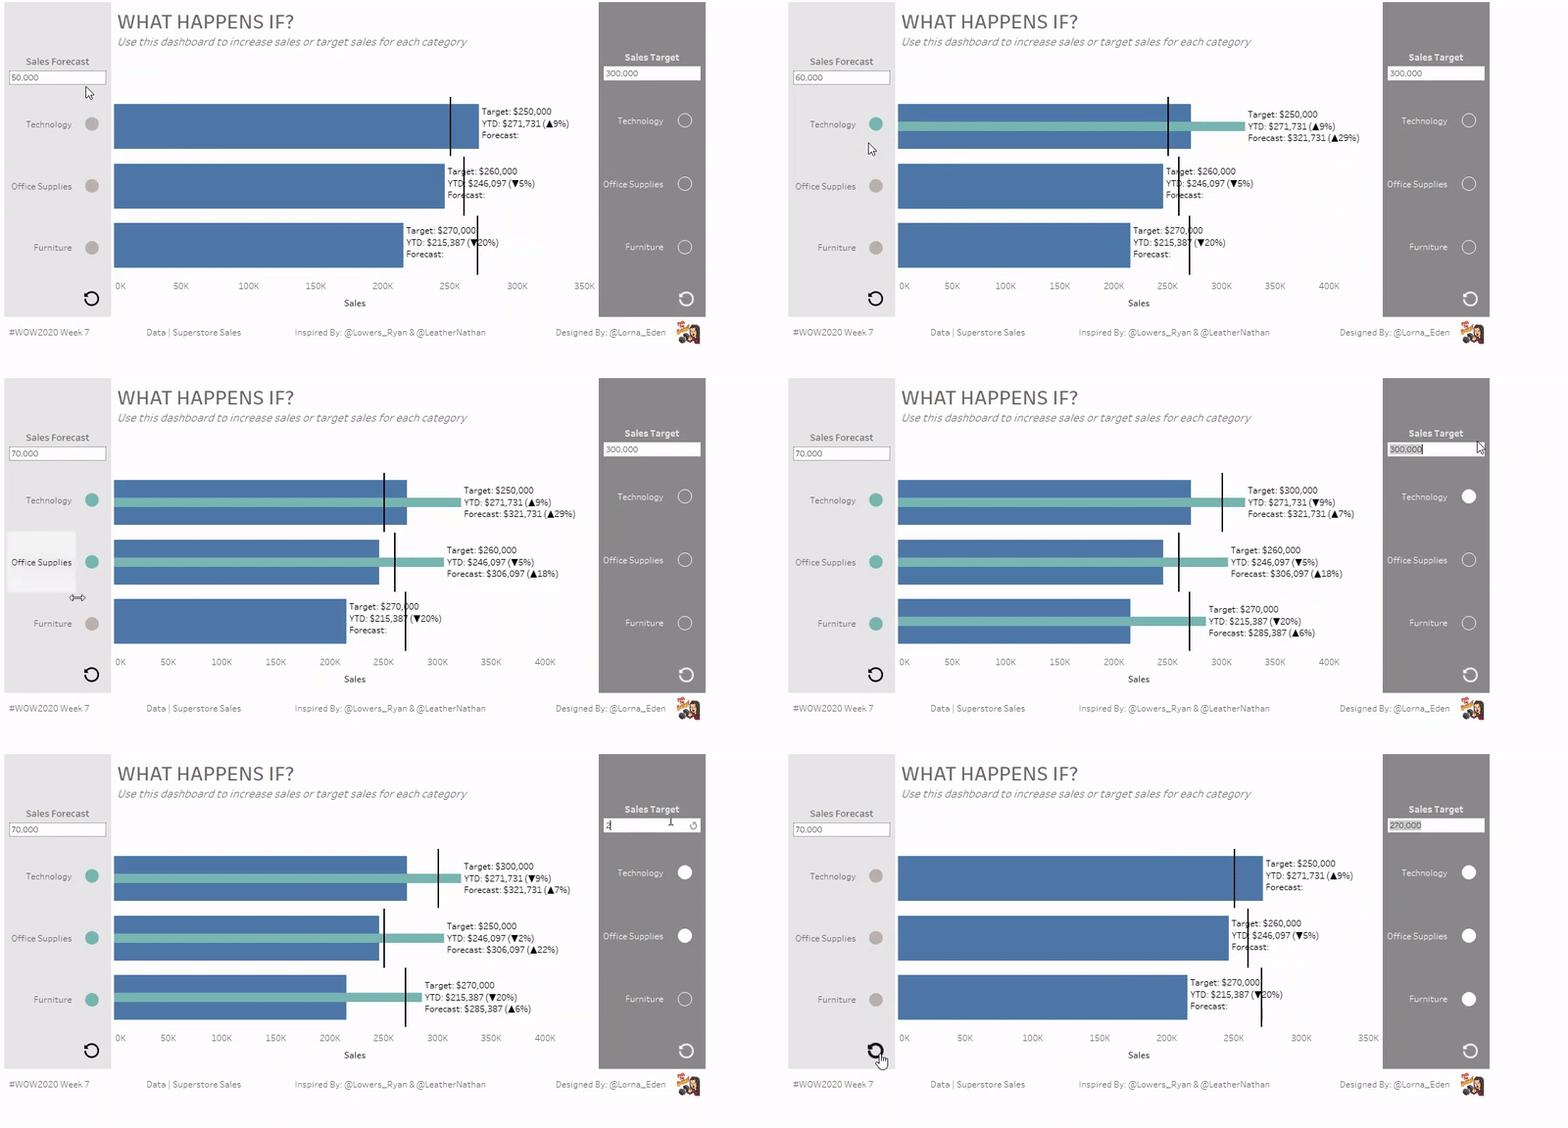
- That shows Target, 2019 sales and Forecast values on labels
- TARGET should be
- Furniture_270000:Office Supplies_260000:Technology_250000:
- Add targets as a gant chart sales
- Use a parameter to input a sales increase for a selected category
- When you enter a sales increase figure and click a category on the left it will add a new bar to the sales chart, to show the new forecast sales
- Use a parameter to update sales targets when a category is clicked on the right
- Add a reset button for both the sales forecast and targets.
- Make sure selections automatically deselect
- Calculate percent change for current value and target, and forecast value and target.
Dataset
This week uses the superstore dataset for Tableau 2019.4. You can get it here at data.world
Attribute
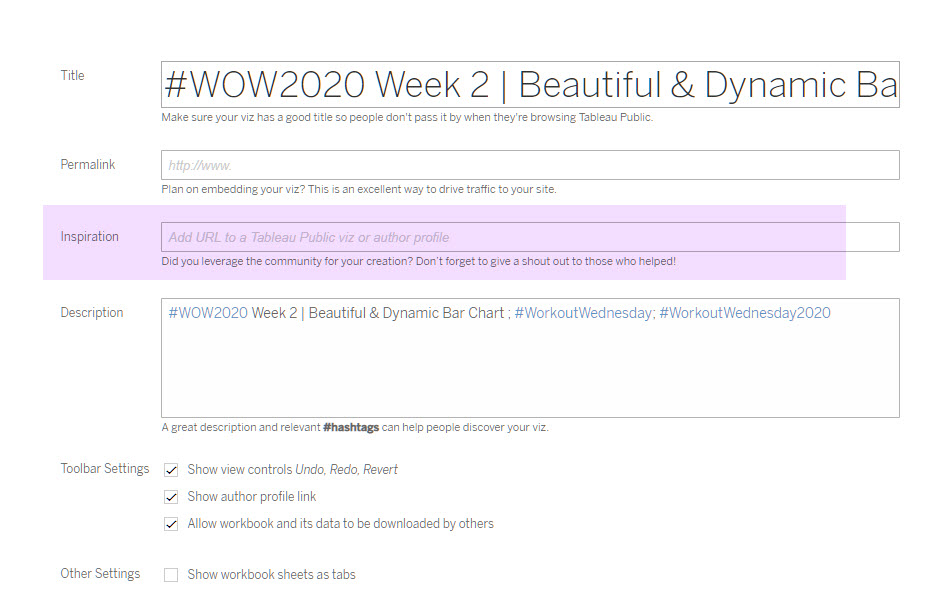
When you publish your solution on Tableau Public make sure to take the time and include a link to the original inspiration. Also include the hashtag #WOW2020 in your description to make it searchable!

Share
After you finish your workout, share on Twitter using the hashtag #WOW2020 and tag @AnnUJackson, @LukeStanke, @lorna_eden, and @HipsterVizNinja

Hi Lorna,
SPECTACULAR CHALLENGE!!
here’s my shot http://bit.ly/WoW2020w07