Introduction
My second challenge for the year!!! This week we are looking at calculating Run Rate based on Weekdays. This challenge is a real time work scenario that I came across last week and it was bit of a struggle to get it working based on just the weekdays. My solution might be a bit complicated but I can’t wait to see what you all come up with!
Requirements
- Dashboard Size: Phone Layout
- # of Sheets – 1
- Create 1 sheet
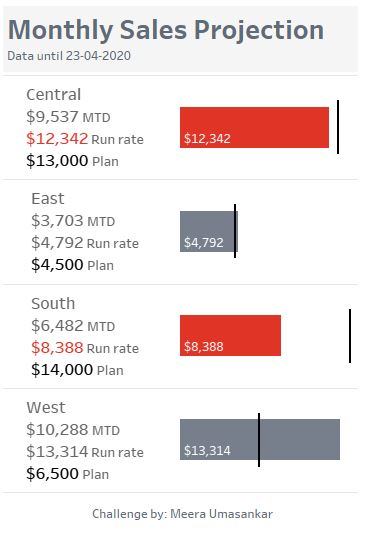
- Show Region, MTD Sales, Run Rate and Plan as text on the left
- Show Run Rate as a bar and Plan as a line on the right
- Calculate MTD – Month To Date
- Calculate Run Rate – (MTD/No. of days so far)* No. of days in a month. Be mindful to use only weekdays in your calculation
- The color of the bar is based on the Plan. If the Run Rate is less than Plan then its a Red
- Do note that Plan number is a monthly plan whereas your other fields are daily
- Formatting
- For the numbers on the left
- Font: Tableau Medium; Size: 12;
- Color: Plan – #000000; Run Rate if less than Plan #e03426 else #606b76
- Title – Font: Tableau Medium; Size: 20; Color: #606b76
- Finishing Elements
- Create a title with dynamic data until date field
- For the numbers on the left
Dataset
Data set is prepped by me. The dataset has 2 sheets – Actuals & Plan
You can get it here at data.world
Attribute
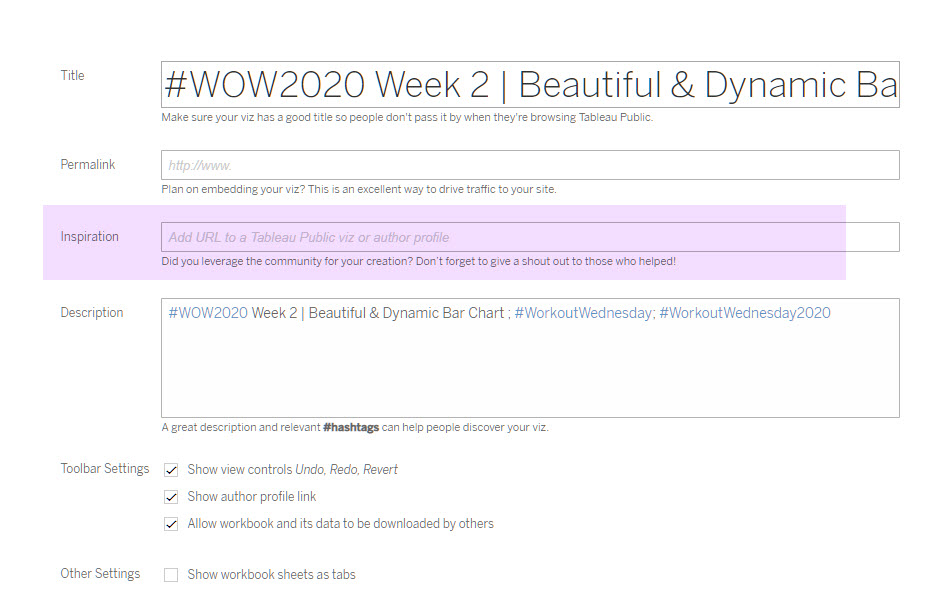
When you publish your solution on Tableau Public make sure to take the time and include a link to the original inspiration. Also include the hashtag #WOW2020 in your description to make it searchable!

Share
After you finish your workout, share on Twitter using the hashtag #WOW2020 and tag @AnnUJackson, @LukeStanke, @_Lorna_Brown and @LosaniMeera
