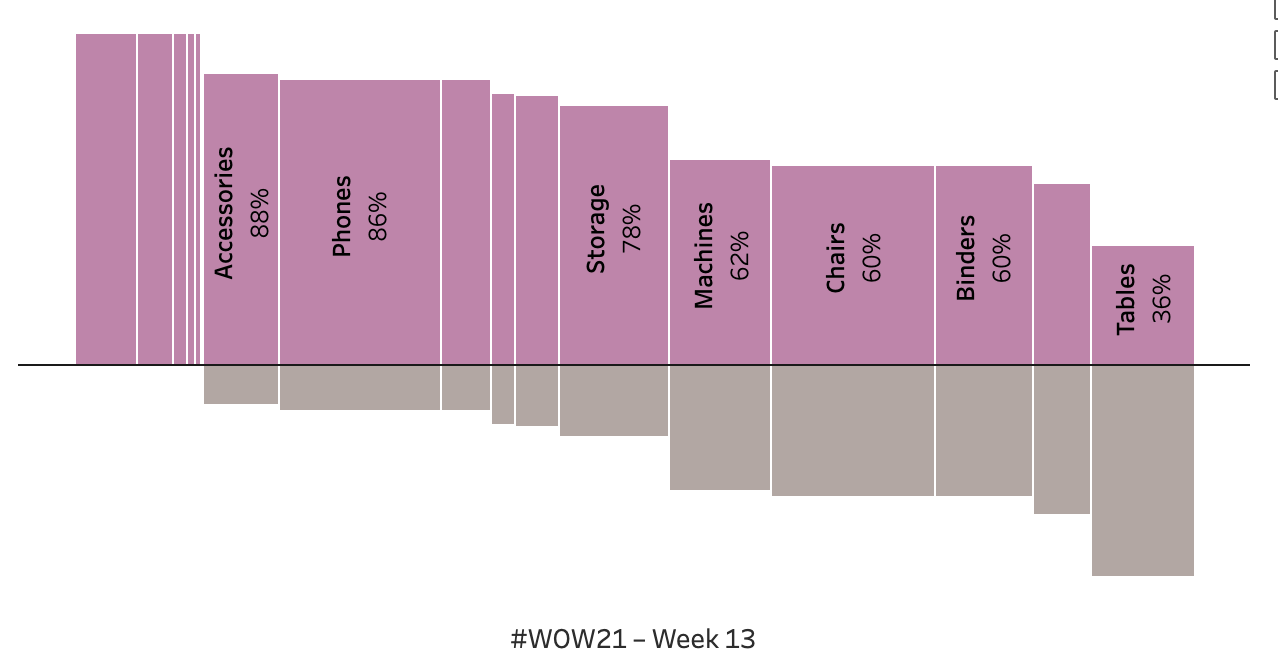
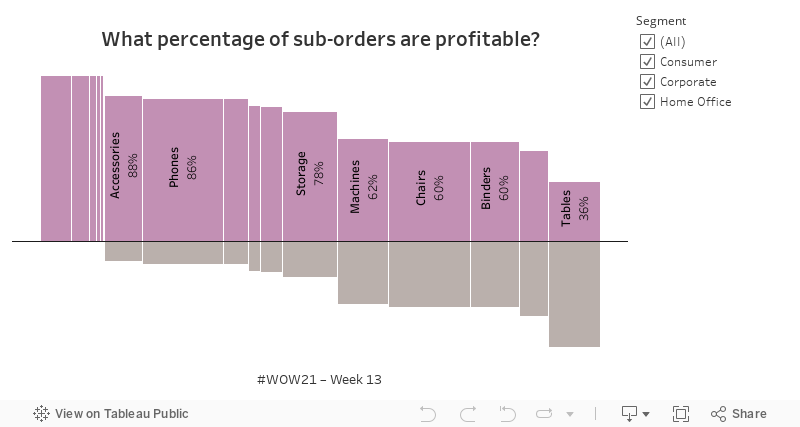
Set the bar height to be percent profitable. The level of analysis should be at the sub-category and order level.
The lower bar should be one minus the percent profitable.
Set the bar width to be percent of total sales (I’ll be watching your axes to tell me if you’ve done this!)
Order the bars by the percent profitable metric then on the percent of total sales.
Add labels and format.
Add animation.
Dataset
This week uses the superstore dataset for Tableau 2020.4. You can get it here at data.world
Attribute
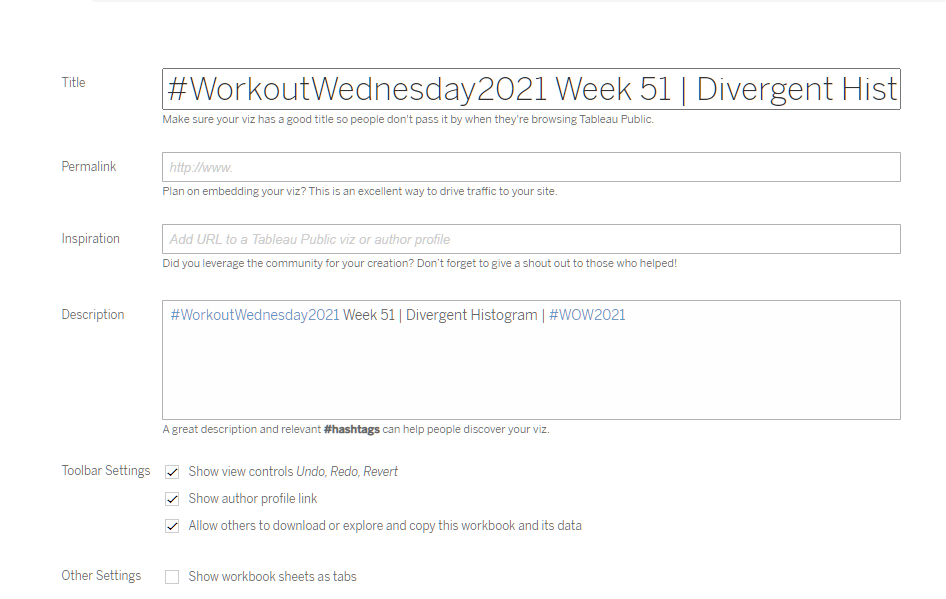
When you publish your solution on Tableau Public make sure to take the time and include a link to the original inspiration. Also include the hashtag #WOW2021 in your description to make it searchable!
3 thoughts on “2021 Week 13 | Tableau: What percentage of sub-orders are profitable?”
Fi Gordon
Hey folks, hope you’re well.. I noticed that #wow2021 under the share title, opens twitter with the search of #WorkoutWednesday2019 🙂
Steffen
I really like how every Zen Master appears to have his specific area of extraordinary expertise.
Luke for me will always be the TC Master whereas for example Rosario Gauna is the Queen of Drilldowns.
Guess I got a solution but as you figured, Luke, I needed LODs. Am really looking forward to how you did it.
Also, my sorting works but seems overdone somehow. Finally. I can’t get my zero lines to show properly. Guess the way I approached the solution somehow wasn’t optimal
Ranjith
Hi Luke,
It would be helpful if u post the solution video. Thanks!!

Hey folks, hope you’re well.. I noticed that #wow2021 under the share title, opens twitter with the search of #WorkoutWednesday2019 🙂
I really like how every Zen Master appears to have his specific area of extraordinary expertise.
Luke for me will always be the TC Master whereas for example Rosario Gauna is the Queen of Drilldowns.
Guess I got a solution but as you figured, Luke, I needed LODs. Am really looking forward to how you did it.
Also, my sorting works but seems overdone somehow. Finally. I can’t get my zero lines to show properly. Guess the way I approached the solution somehow wasn’t optimal
Hi Luke,
It would be helpful if u post the solution video. Thanks!!