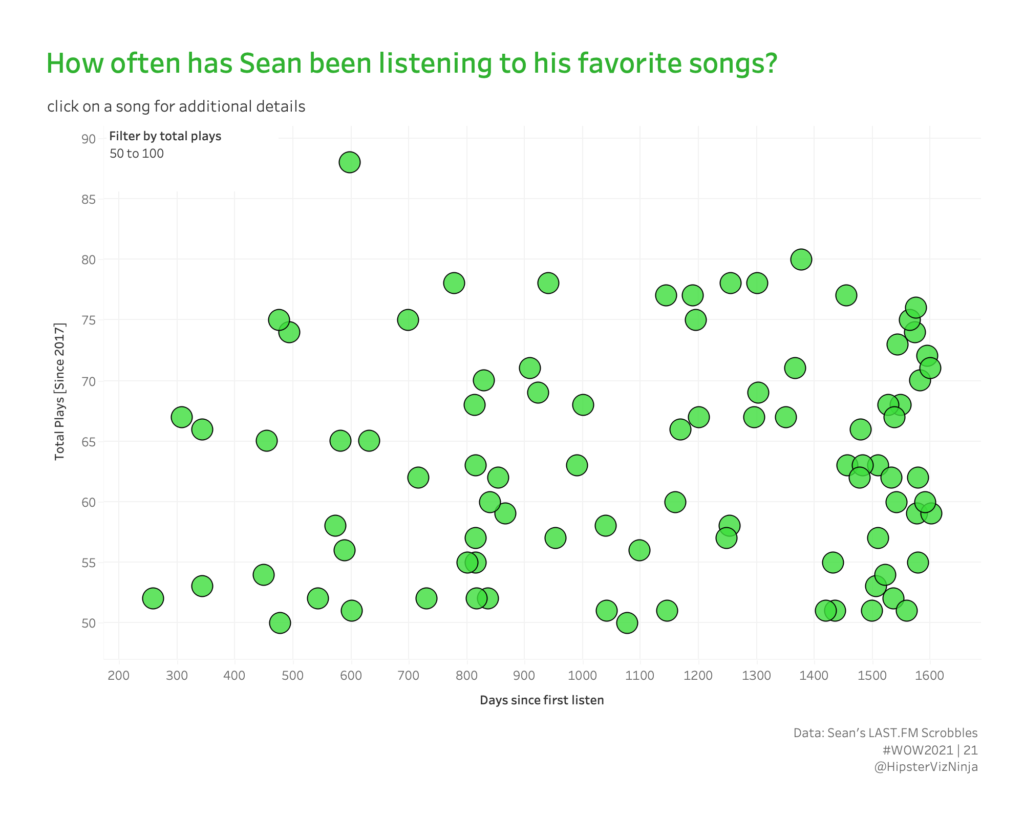
#WOW2021 week 21: How often is Sean listening to his favorite songs?
Introduction I’m really putting myself out there this week. But it’s for a good cause, so here we go! If you aren’t familiar, I love listen to music…who doesn’t though, right? Pretty sure I’m in the majority here. Anywho, being that my second hobby is data visualization, I really like visualizing about music. So anytime …
#WOW2021 week 21: How often is Sean listening to his favorite songs? Read More