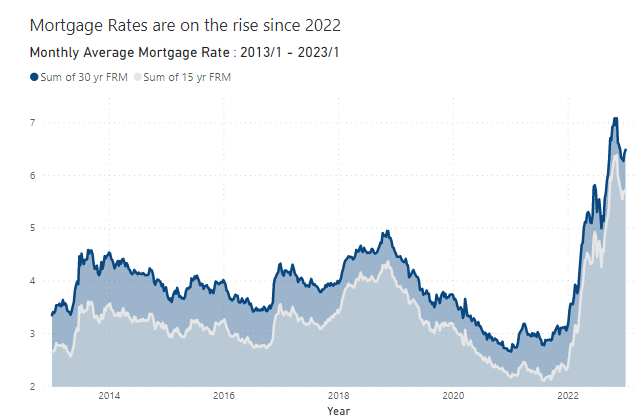
2023 Week 04 | Power BI: Mortgage Rates Area Chart
Introduction Hello everyone! I’m excited to have my first challenge of 2023 up and ready for your enjoyment. Last year I got a reputation as providing challenges that were, let’s say….a little on the easier side, so this year I’m just going to own it! I was scrolling Twitter in hopes of finding some inspiration …
2023 Week 04 | Power BI: Mortgage Rates Area Chart Read More