The Thanksgiving NFL Games History

Introduction

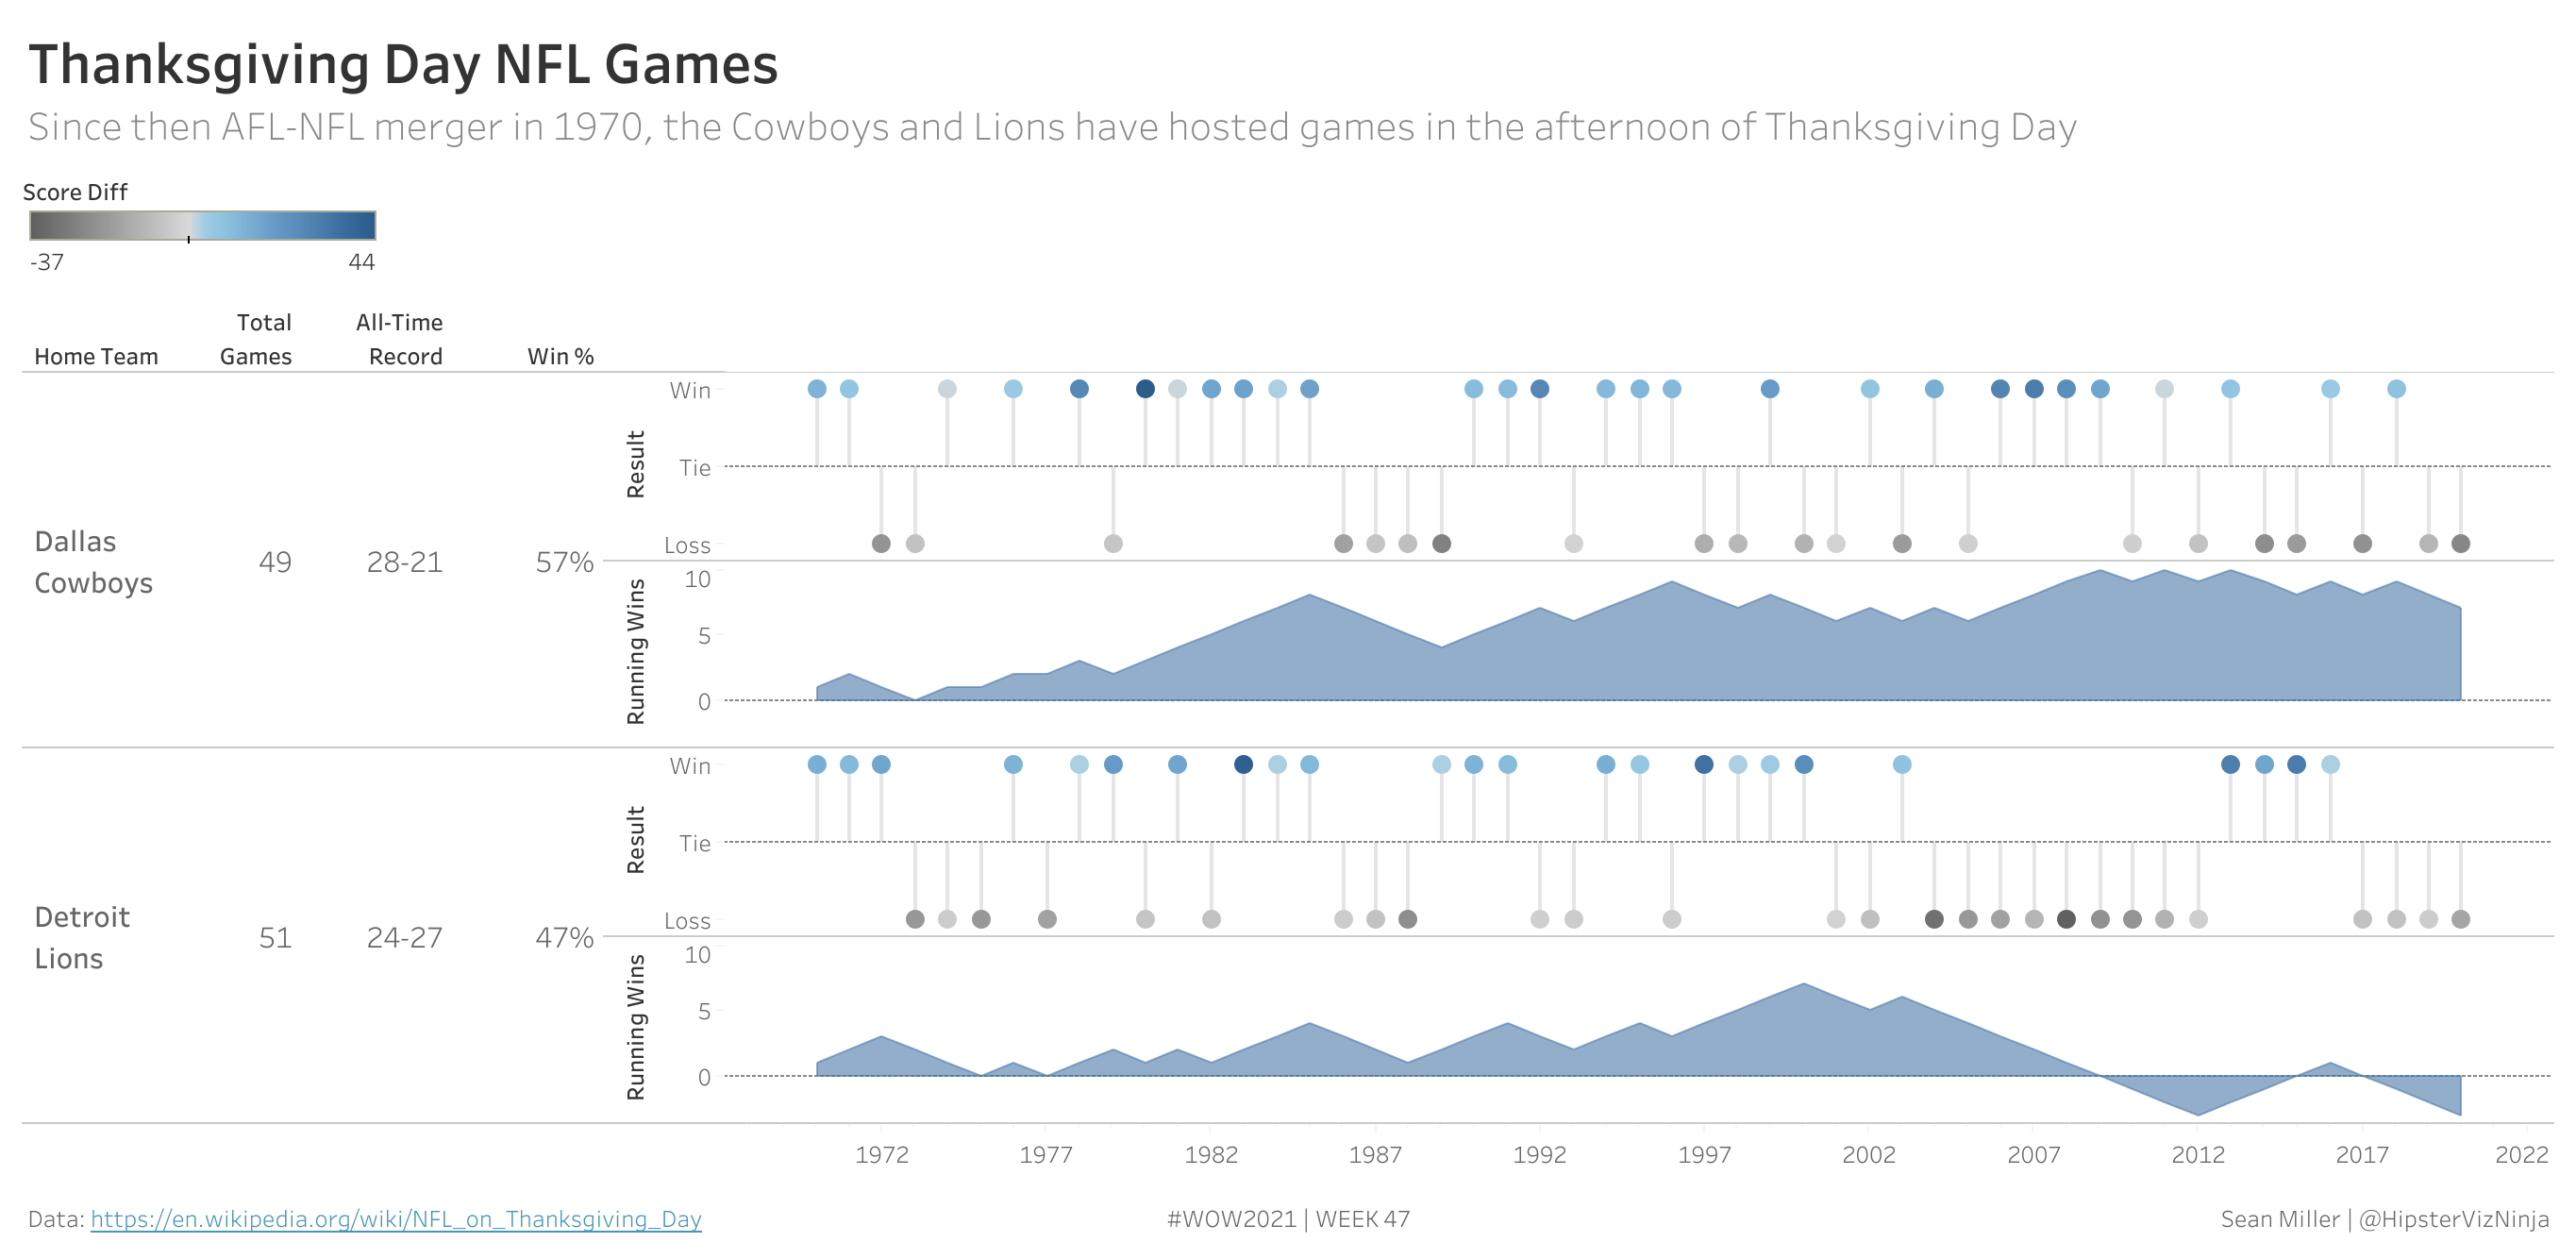
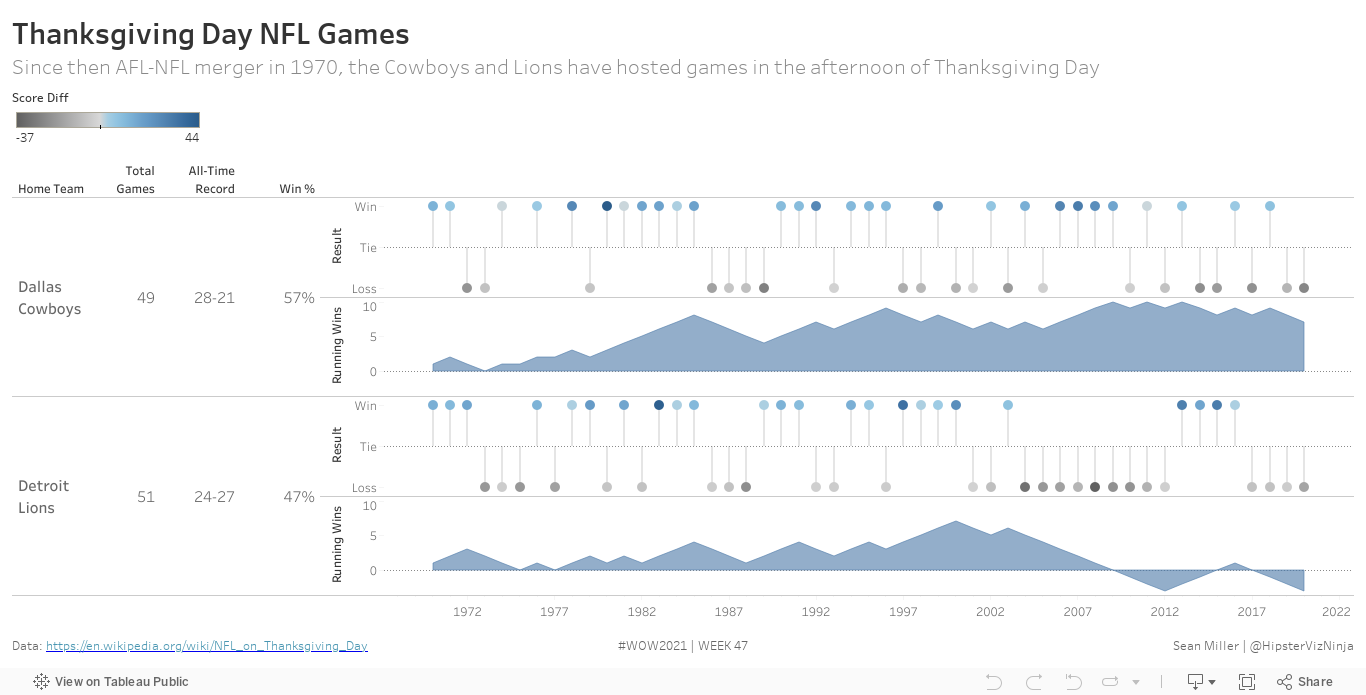
Happy Turkey day! This week is Thanksgiving in US and for many, it means honoring the long-standing tradition of watching two (2) NFL games during the day. Since 1970, the Dallas Cowboys and Detroit Lions have hosted an opponent on the afternoon of Thanksgiving Day.

So what better way to celebrate than a nice easy dashboard looking into the history of all those games. 

Requirements

  • Dashboard Size: Generic Desktop
  • # of Sheets – 1
  • Create a lollipop chart showing the Wins – Losses for each team and year. 
    • Mind the Axis Labels! 
    • The color of the dot is the score difference between the home team and visiting team
  • Create an area chart showing the cumulative win differential over time.
  • For each home team show:
    • The total games played
    • All-time Record (W-L-T)
    • Win % (Wins / Total Games)
  • Match formatting
  • Match tooltips


Dataset

You can get it here at data.world

Attribute

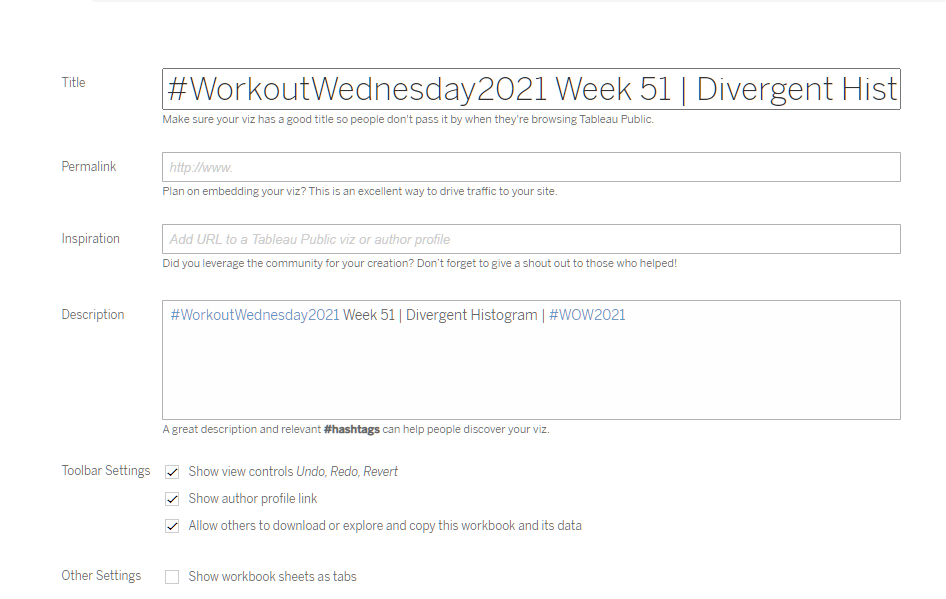
When you publish your solution on Tableau Public make sure to take the time and include a link to the original inspiration.  Also include the hashtag #WOW2021 in your description to make it searchable!

Share

After you finish your workout, share on Twitter using the hashtag #WOW2021 and tag @AnnUJackson, @ItsCandraM, @LukeStanke, @_Lorna_Brown and @HipsterVizNinja

Solution

Interactive

Leave a Comment

Your email address will not be published. Required fields are marked *

Scroll to Top