This week my challenge comes from two places of inspiration. Firstly the ONS website and secondly a final interview for someone applying to the Data School. I loved the concept of the chart and it helps with context and also synchronisation of axis. Have fun.
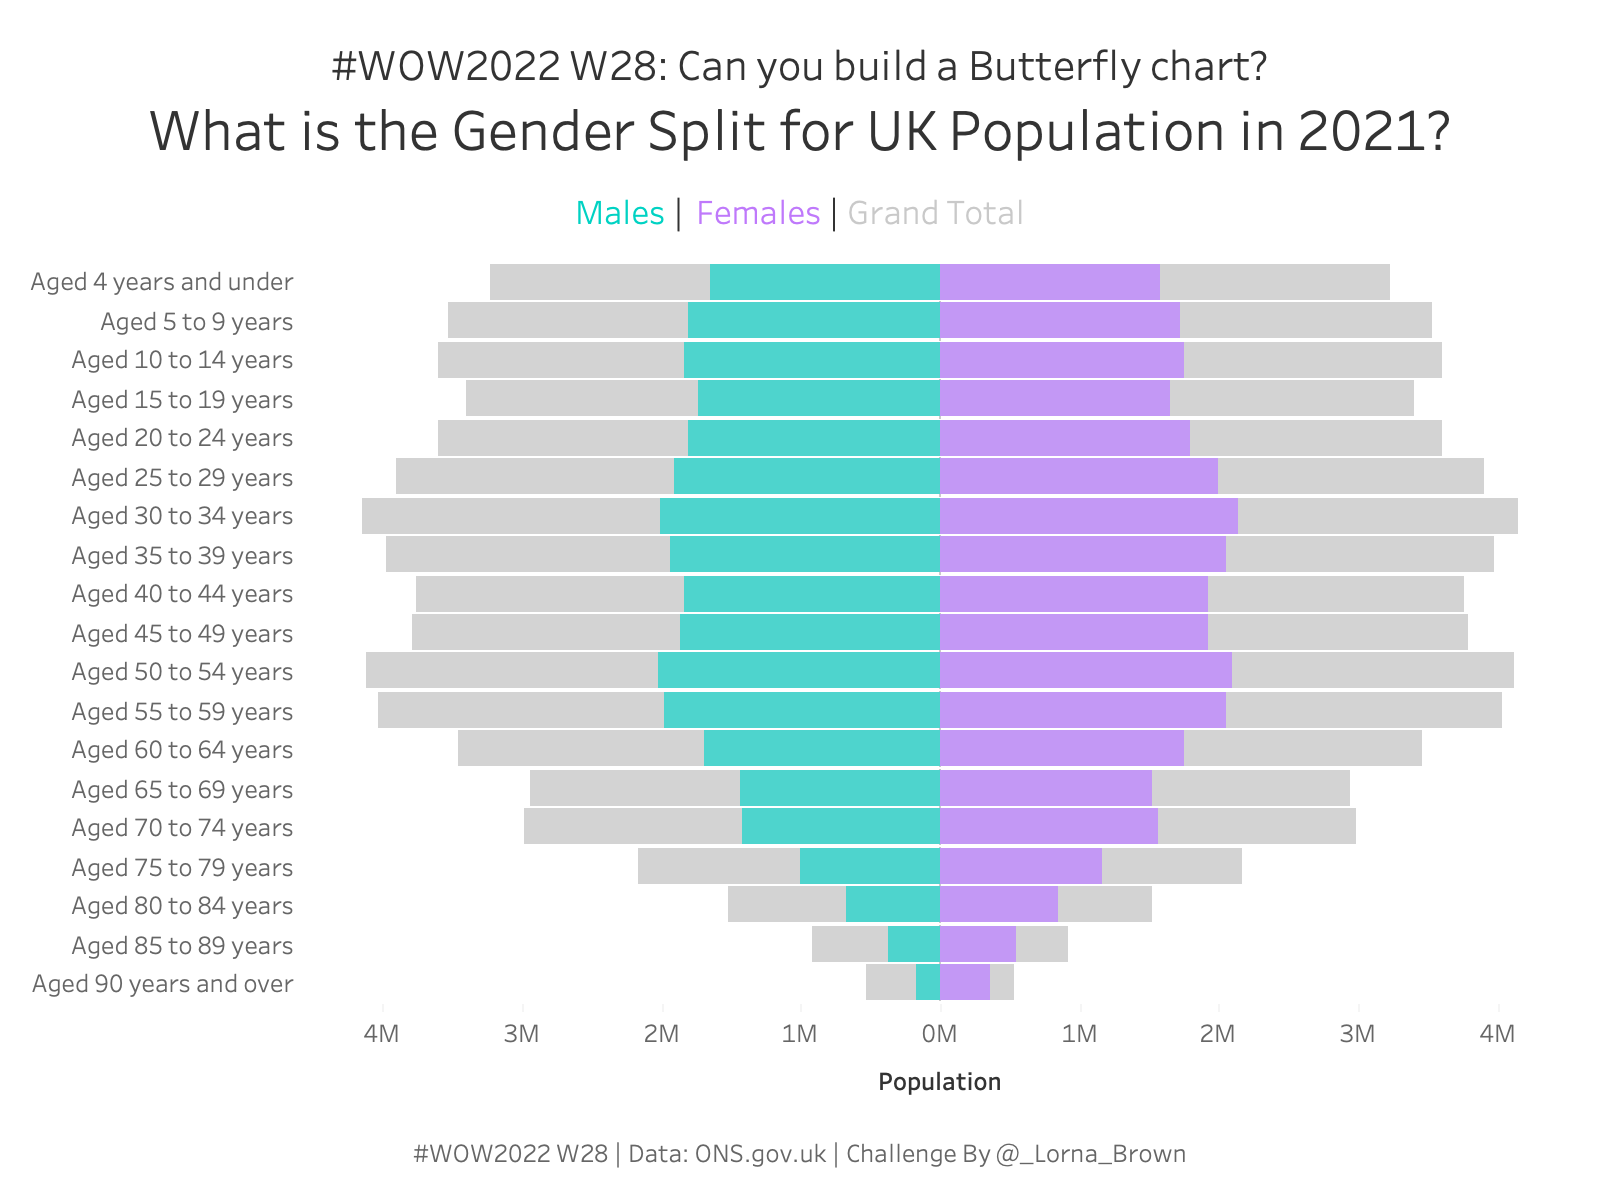
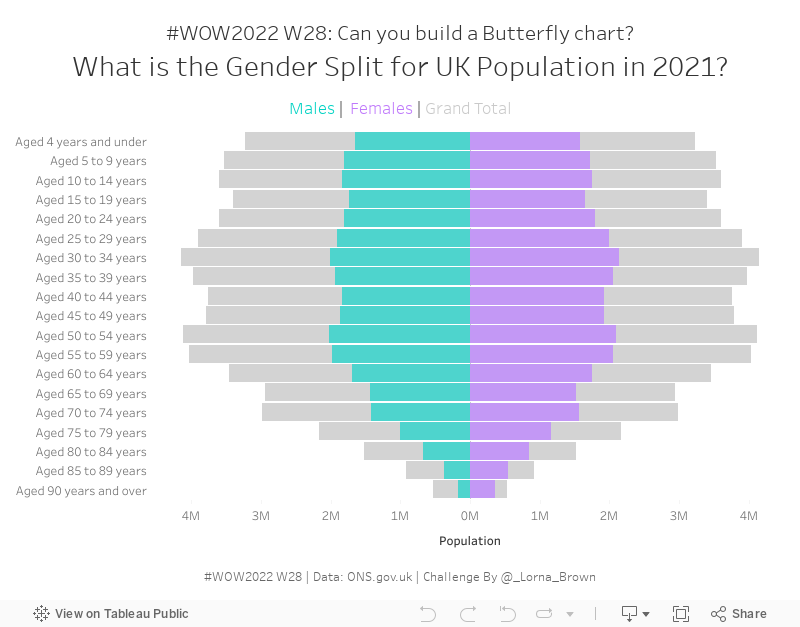
Create a butterfly chart showing Male and Female population for 2021
Add context to show the total population
Format tooltips and axis the same
You can do this two ways. Ideally this challenge is focusing on LODs. To need the LOD you need to pivot the data so it has a row per Gender per year. Then we can just keep 2021.
Dataset
You can download the data from the ons.gov.uk website by clicking here
Attribute
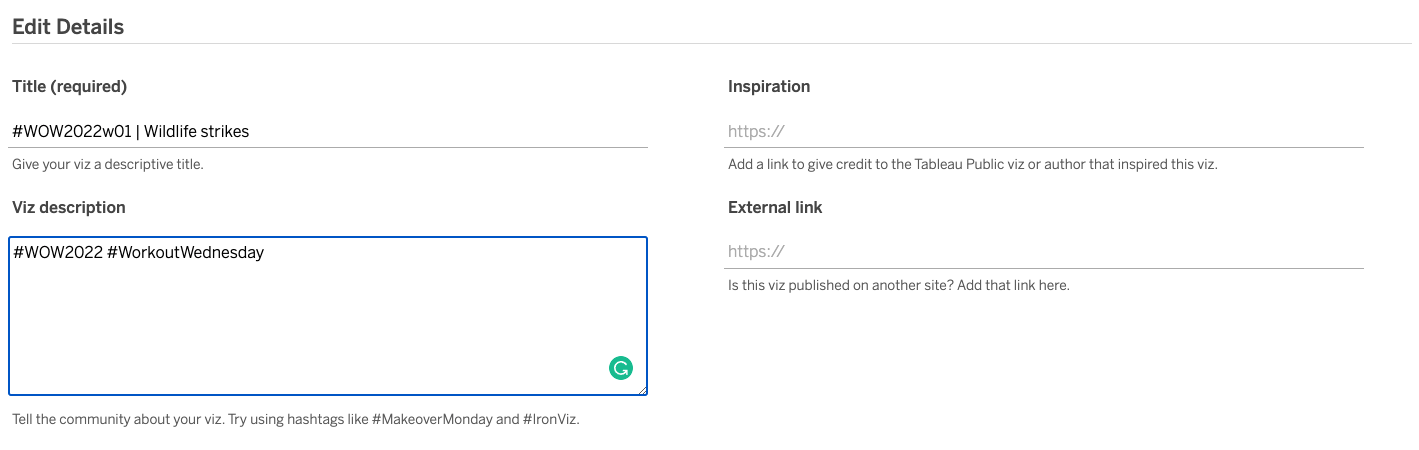
When you publish your solution on Tableau Public make sure to take the time and include a link to the original inspiration. Also include the hashtag #WOW2022 in your description to make it searchable!