This week’s challenge is inspired by a Makeover Monday I did a couple years ago, which was inspired by Lindsey Poulter‘s Set Actions workbook. But rather than use the same soccer data, I’m continuing to celebrate the start of baseball season by comparing two Major League Baseball greats.
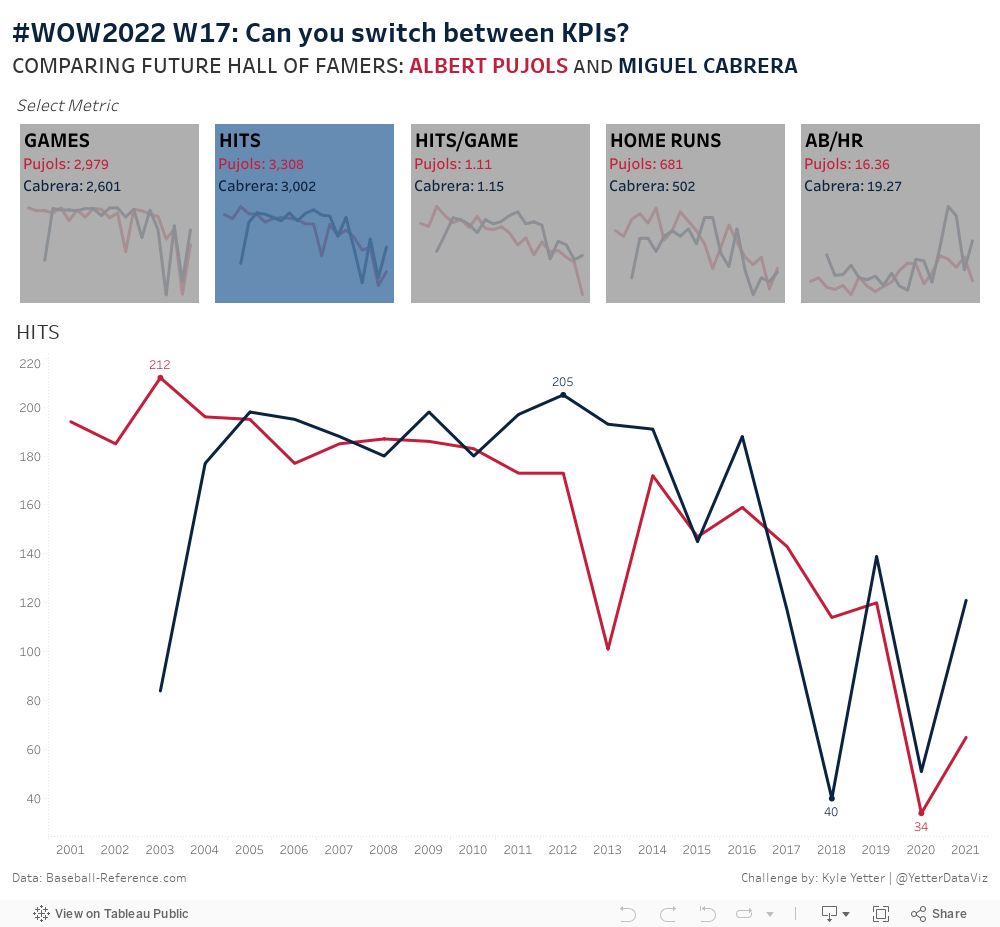
The overall challenge here is to switch between metrics/KPIs by clicking on the thumbnails, which provide a preview of each metric.
Create a metric selection sheet, showing career totals for both players for the following metrics:
Games ([G])
Hits ([H])
Hits/Game (SUM([H])/SUM([G]))
Home Runs ([HR])
At Bats/Home Run (SUM([AB])/SUM([HR]))
Hint: You’ll need to create these metric labels
Highlight the selected metric
Selected: #8bc2be; Not Selected: #dedede
Create a thumbnail chart/sparkline for each metric
Create a chart that displays the selected metric
Match formatting and tooltips (including highlights when selecting a metric)
Dataset
This week uses a custom dataset of career stats for Albert Pujols and Miguel Cabrera you can find on Data.World
Attribute
When you publish your solution on Tableau Public make sure to take the time and include a link to the original inspiration. Also include the hashtag #WOW2022 in your description to make it searchable!