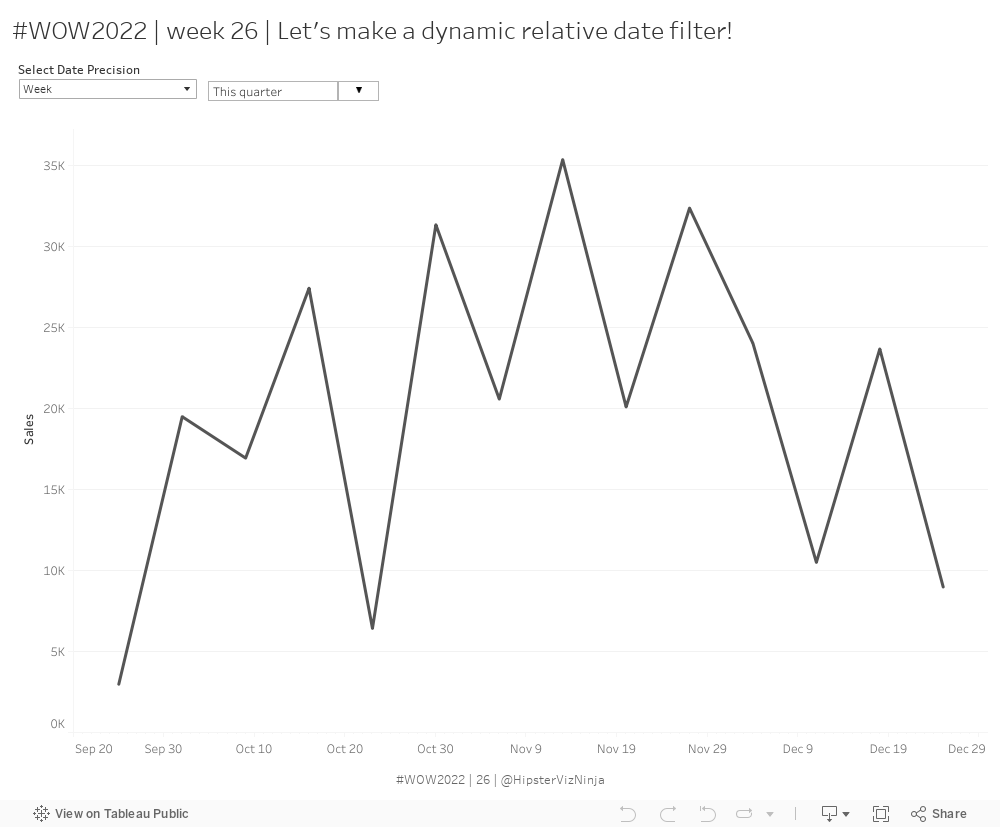
Welcome to week 26 – the halfway mark of 2022! This week is pretty straightforward; how simple it will be is up to you 😀
I’ve always really liked using the relative date filter in Tableau but one thing that’s always irked me is that the anchor date is not dynamic – neither end-user nor data refresh will update the anchor date. But now that we have dynamic parameters AND parameter actions, this is now possible. So that’s what we’re going to do this week!
Using the out of the box relative date filter as a template, let’s make it dynamic!
Create a line chart showing the measure of your choice
Recreate the relative date filter
users select date part
users select time period
Last
This
Next
users can also select custom period lookup
Last
Next
period to date
Users input n periods
Show the applied date range
Allow users to change the precision of the date in the view
Day
Week
Month
Quarter
Year
Dataset
This week uses Superstore – use whatever version you want or you can find it here on Data.World
Attribute
When you publish your solution on Tableau Public make sure to take the time and include a link to the original inspiration. Also include the hashtag #WOW2022 in your description to make it searchable!
This would seem straight forward, but after reviewing your workbook, there is a LOT of thought and detail that went into how you set up the show/hide dashboard object to mimic a relative filter with additional user-defined variables! The combination of change parameter and false highlight actions, along with the calcs that drive the UI text outputs, chart filters, and trend output granularity is pretty sublime. Thanks for sharing!
Tina
I can’t believe this dynamic relative filter can be made manually piece by piece. Amazing! And I learned a lot of tricks from this step by step video, thanks for sharing!

This would seem straight forward, but after reviewing your workbook, there is a LOT of thought and detail that went into how you set up the show/hide dashboard object to mimic a relative filter with additional user-defined variables! The combination of change parameter and false highlight actions, along with the calcs that drive the UI text outputs, chart filters, and trend output granularity is pretty sublime. Thanks for sharing!
I can’t believe this dynamic relative filter can be made manually piece by piece. Amazing! And I learned a lot of tricks from this step by step video, thanks for sharing!