Introduction
October is Community Month here at Workout Wednesday. This means that each challenge will be brought to you by a guest coach from our wonderful data community
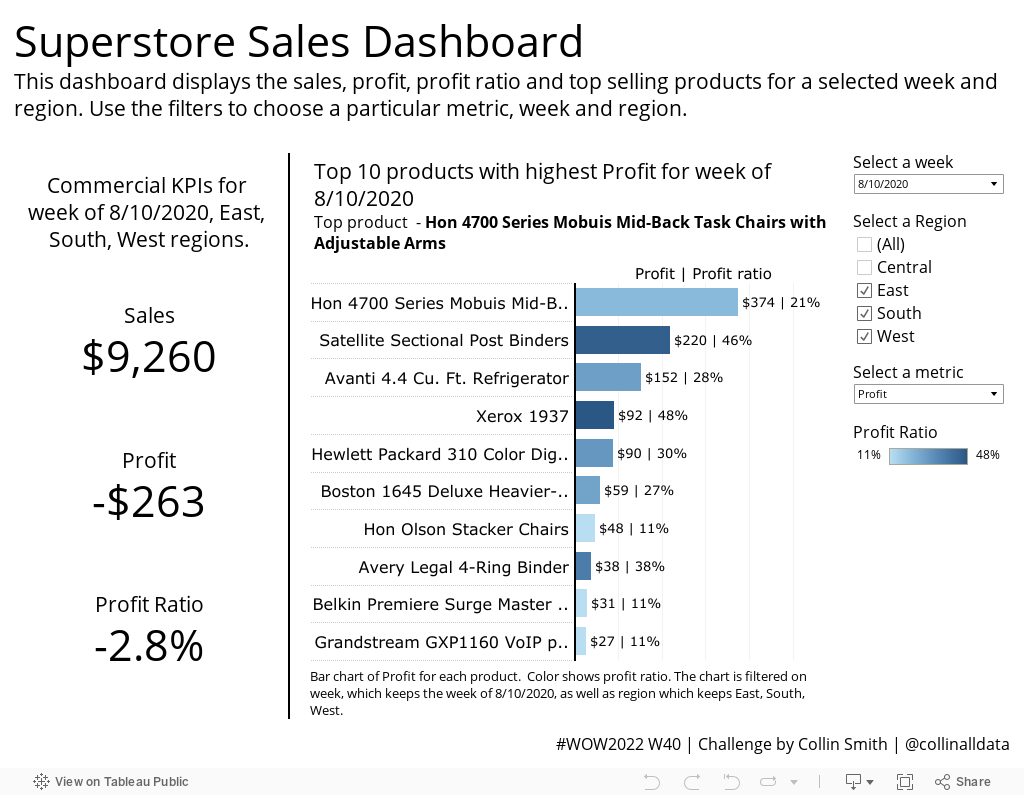
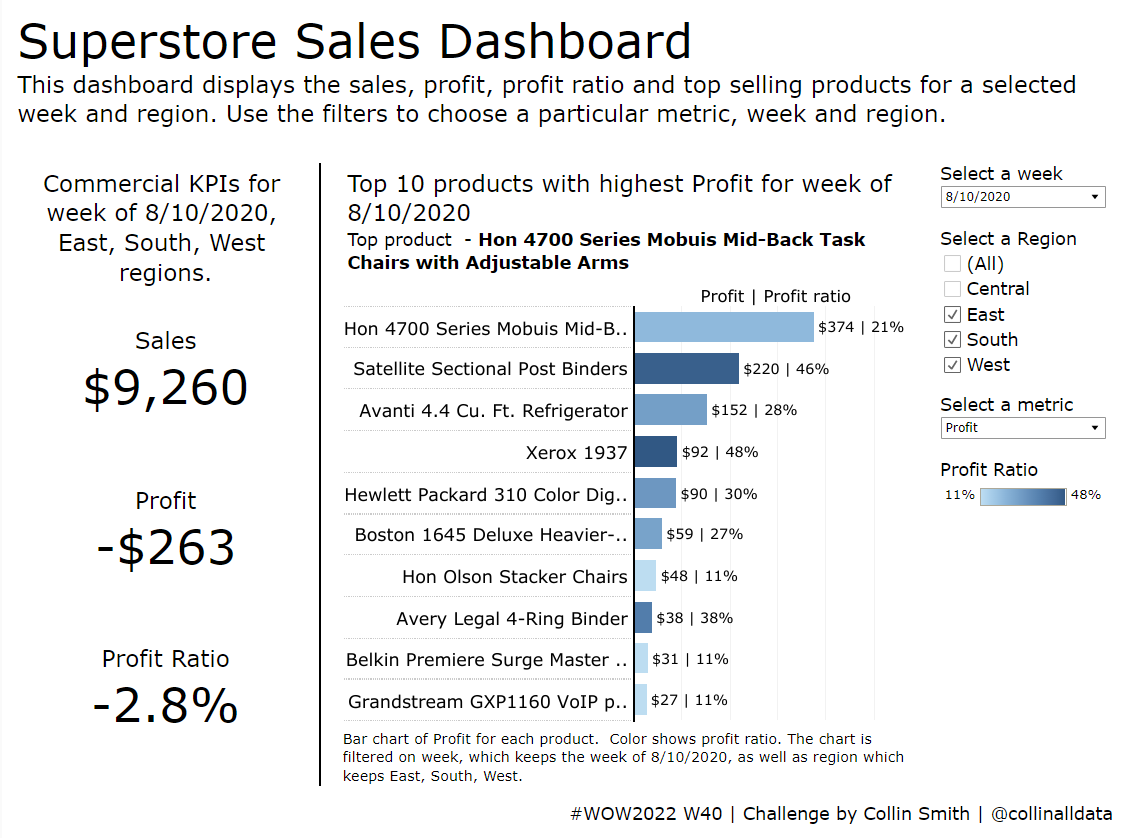
Kicking things off this week, we have a challenge by Collin Smith (@collinalldata).
“Have you ever tried to incorporate accessibility into a Tableau dashboard? Incorporating accessibility into our designs is a way to ensure that as many people as possible can use, understand, and have access to our visualizations. Some principles of accessibility are easy to implement in Tableau. These include principles of universal design like appropriate use of white space, keeping text size from getting too small and ensuring that we don’t use color pallets that are indistinguishable to people with color-blindness.
Other elements of accessibility are harder to implement, partly due to the way that Tableau dashboards are constructed. These include setting a logical focus order (the order in which a user can press the tab button to navigate an application without a mouse) and making the data in the visualization readable by a screen-reader. These elements are critical for keyboard-only users and users with vision impairment. Even with intentional design choices, there are still hiccups and imperfections that even the best Tableau developer cannot avoid. When designing in Tableau, it is important to keep in mind a principle from Chartability (a data experience accessibility checker) and approach “accessibility as a scale rather than a state.”
To that end, this week’s Workout Wednesday will have multiple tiers, based on the involvedness of various elements of accessible design and the scale to which you want to introduce accessibility into your visualization. These tiers are set out in the requirements section.”
Requirements
Tier 1 Requirements
- Dashboard size 1000 x 800
- No more than 5 sheets
- Match ALL formatting
- Font: Verdana
- H1: 32pt
- H2: 16pt
- H3: 12pt
- Label: 10 pt
- Match tooltips
- Match functionality including dynamic text
Tier 2 Requirements
- All tier 1 requirements
- Match focus order (learn more about focus order in Tableau here)
- Full use of dashboard filters and selectors using only keyboard
- Tip: ALWAYS make a copy of your dashboard before adjusting XML
Tier 3 Requirements
-
- All tier 1 and 2 requirements
- Match screen reader functionality (Use Navigator on Windows, NVDA, JAWS, or VoiceOver on Mac)
- Screen reader must read aloud full KPI section including all dynamic text and metrics
- Screen reader must read instructions “To open view data pane, click control, shift, enter”
Dataset
This week uses an adapted Superstore data set. You can find it here on Data.World
Attribute
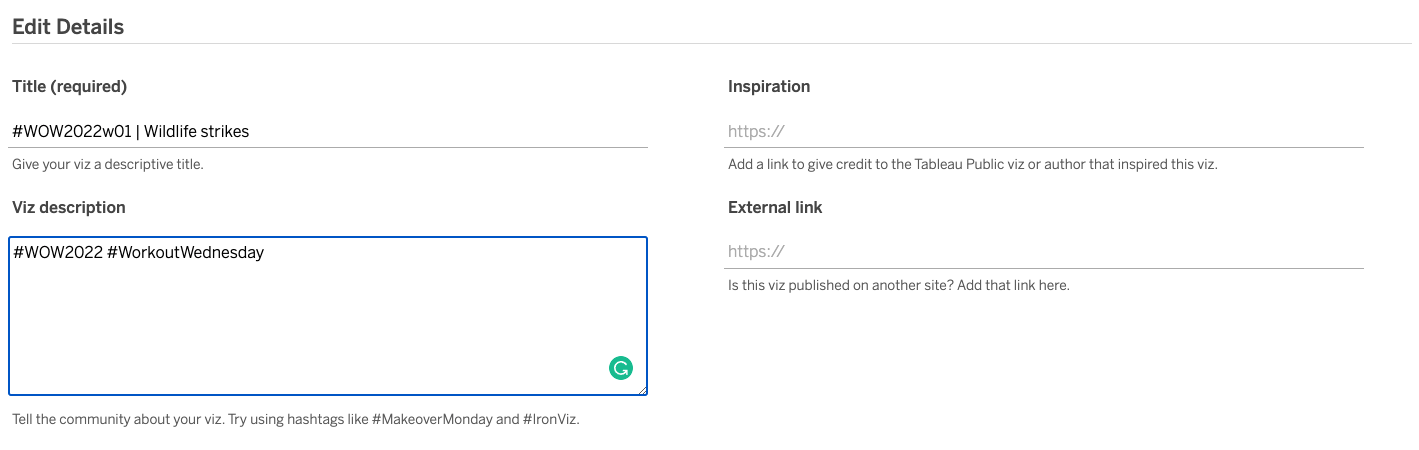
When you publish your solution on Tableau Public make sure to take the time and include a link to the original inspiration. Also include the hashtag #WOW2022 in your description to make it searchable!
Share
After you finish your workout, share on Twitter using the hashtag #WOW2022 and tag @collinalldata @LukeStanke, @_Lorna_Brown, @HipsterVizNinja, @_hughej, and @YetterDataViz
Solution
Interactive