Man, sometimes the #datafam is just so very inspiring. I recently saw this tweet by Visionary, Klaus Schulte, this week and immediately knew I wanted to make a challenge out of it.
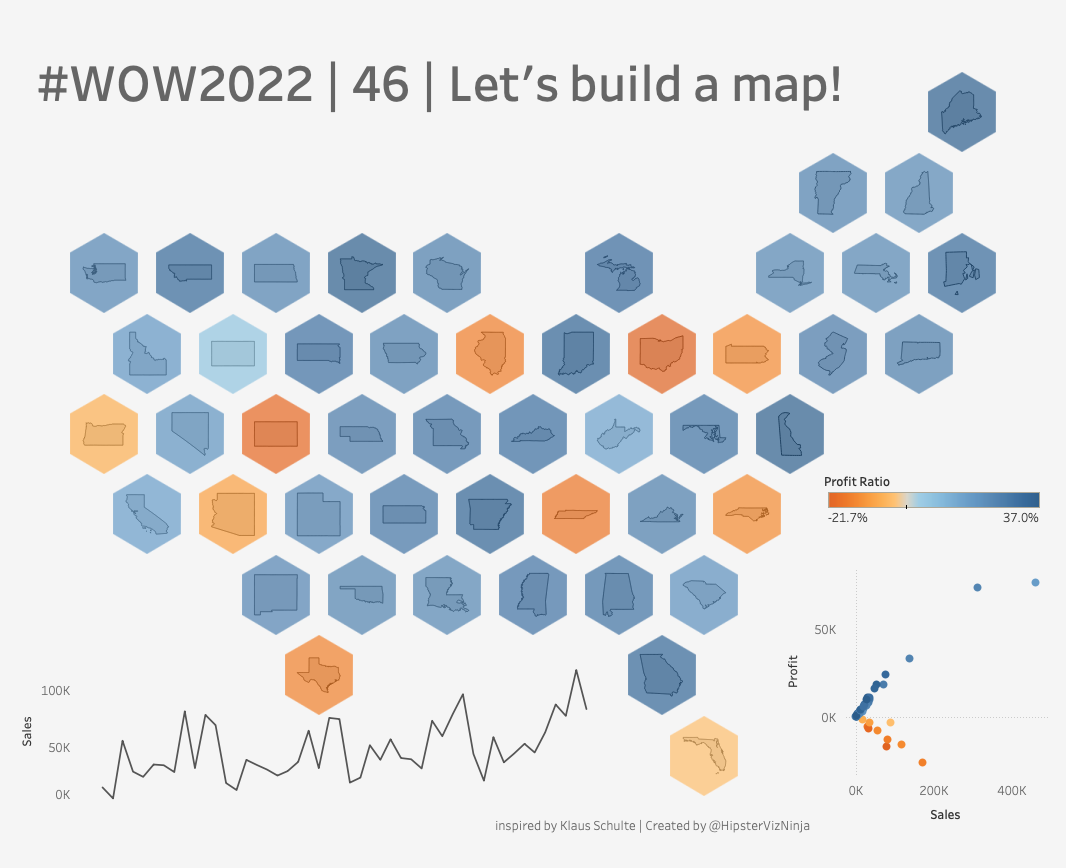
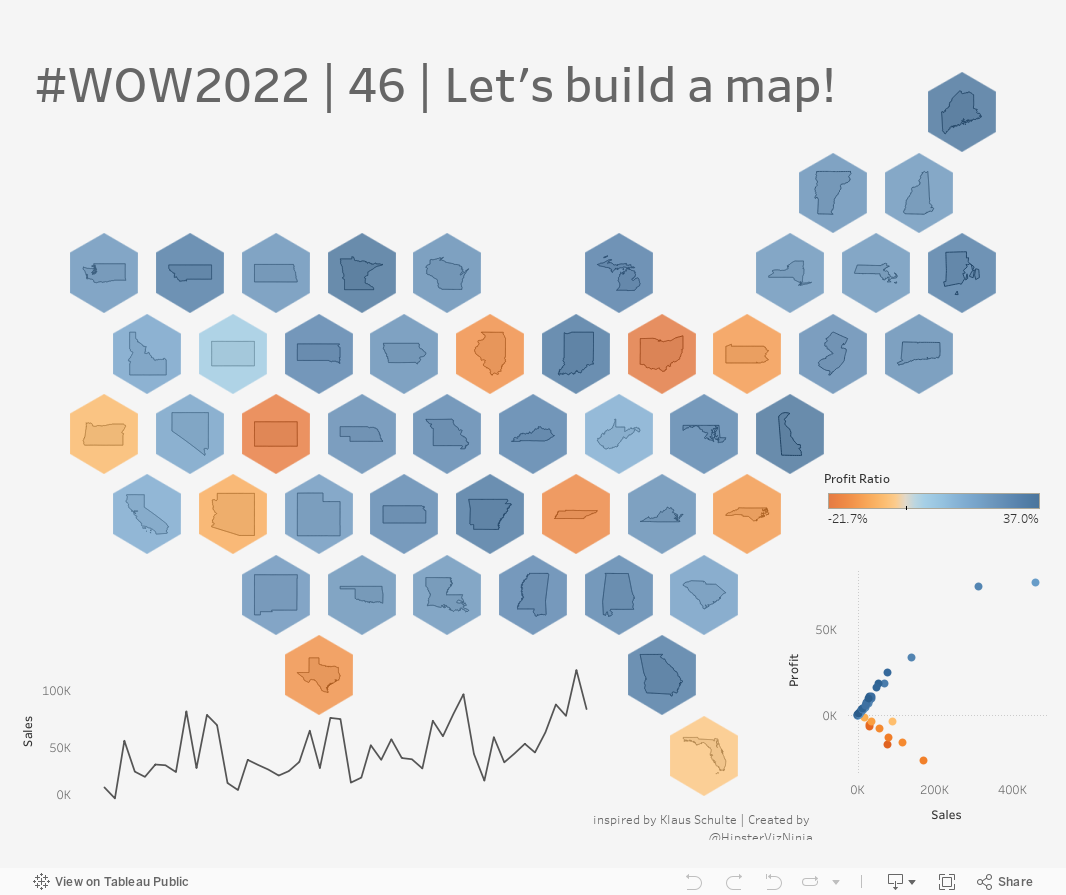
The premise is quite simple – make a tile map but also add the state outline to further assist readers to where certain states are. This is such a brilliant addition to the space-saving tile maps we’re used to building. After digging into Klaus’s solution, I was able to sort out what he did. you’ll notice this solution here is not exactly what Klaus did but I believe this solution is just as good.
Each state should be both a hexagon and show the outline of the state
Create a line chart showing sales by month
Create a scatter chart of sales over profit by state
Match formatting, tooltips and interactivity
HINT You do you NOT need any additional shapes to make this solution work. You will need to add any one of NUMEROUS tile map templates out there
Dataset
You can use whatever version of Superstore you would like…Or BYOD (bring your own data). A copy of Superstore can be found on Data.World
Attribute
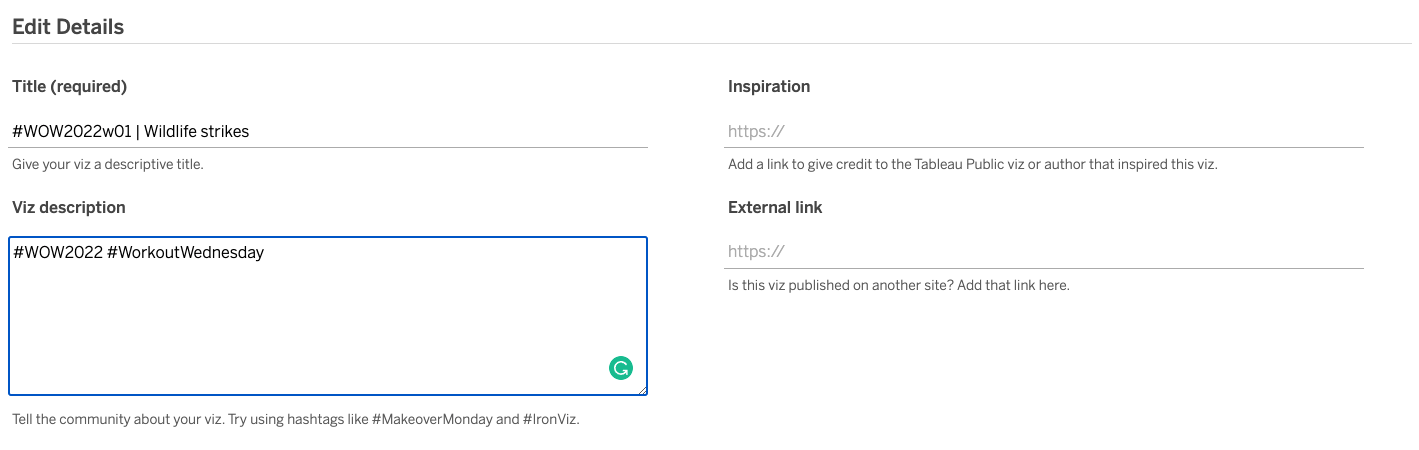
When you publish your solution on Tableau Public make sure to take the time and include a link to the original inspiration. Also include the hashtag #WOW2022 in your description to make it searchable!