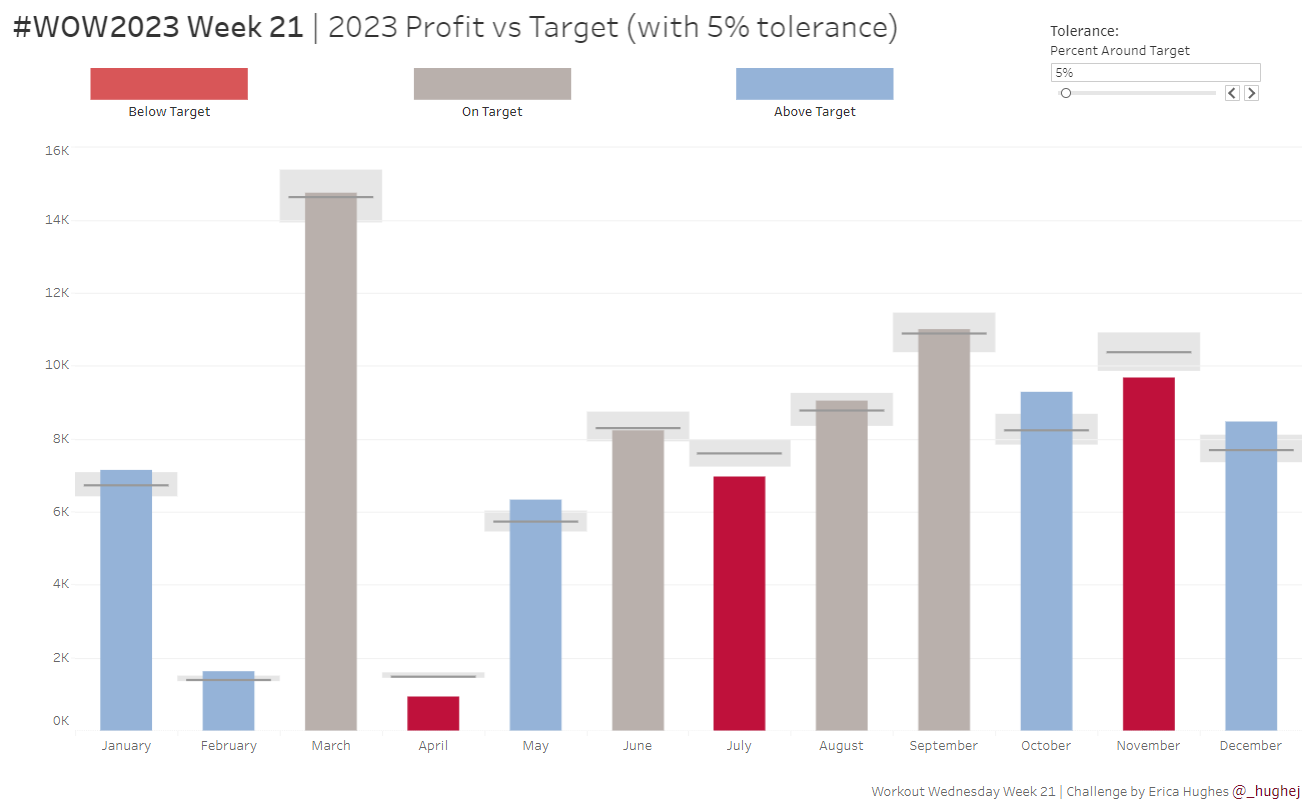
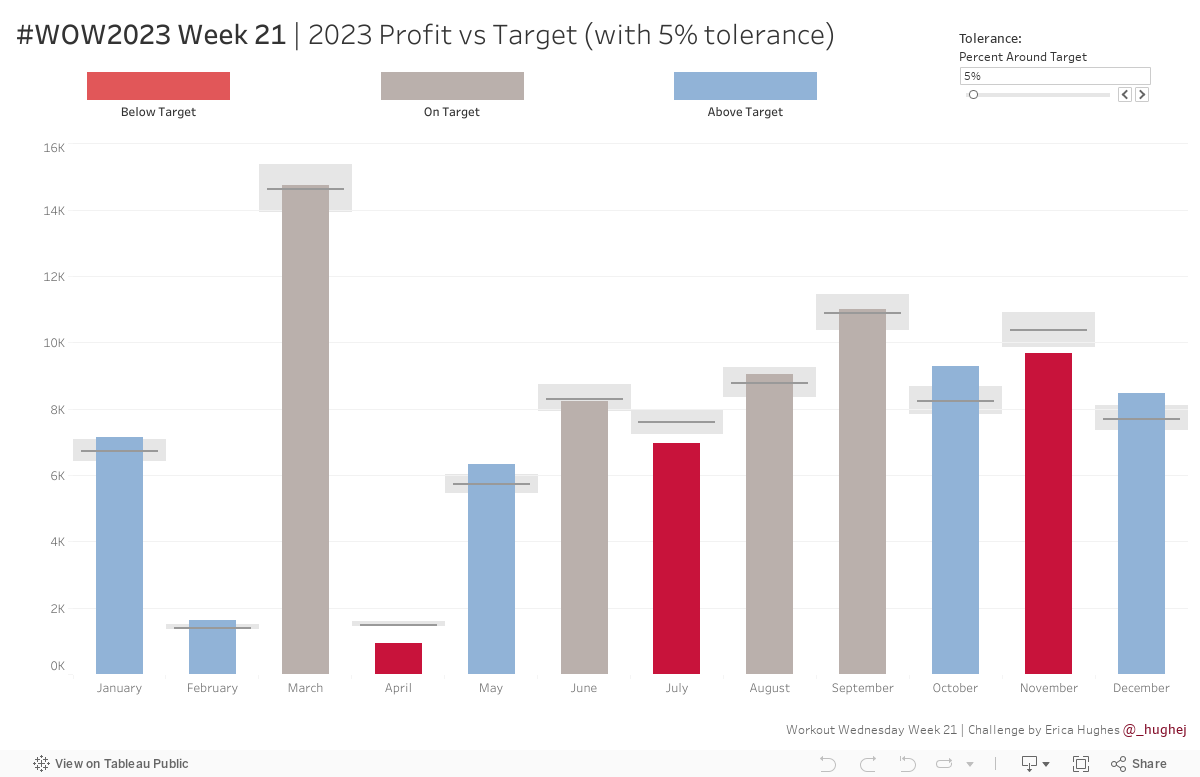
This week’s challenge is a slight twist on the classic Measure (bar) vs Target (gantt) chart. The key difference here is that we want to allow the user to select a ‘tolerance’ around the specific Target value. We only want to highlight months where profit was Above or Below the permited tolerance.
Create a bar chart of Monthly Profits (with Year of Order Date on the filters – I selected 2023 only)
Add a Gantt line for the Target Profit (this field is included in the version of Superstore data used for this challenge)
Use a parameter to set a dynamic ‘Tolerance’ (percentage)
Add grey shading to visually represent the ‘Tolerance’ of x% above or below the Target value
Match tooltips and formatting (Colours – Below Target: #c8133ba, On Target: #bab0ac, Above Target: #91b3d7)
Dataset
This week uses an adapted Superstore data set. You can find it here on Data.World
Attribute
When you publish your solution on Tableau Public make sure to take the time and include a link to the original inspiration. Also include the hashtag #WOW2023 in your description to make it searchable!