Introduction
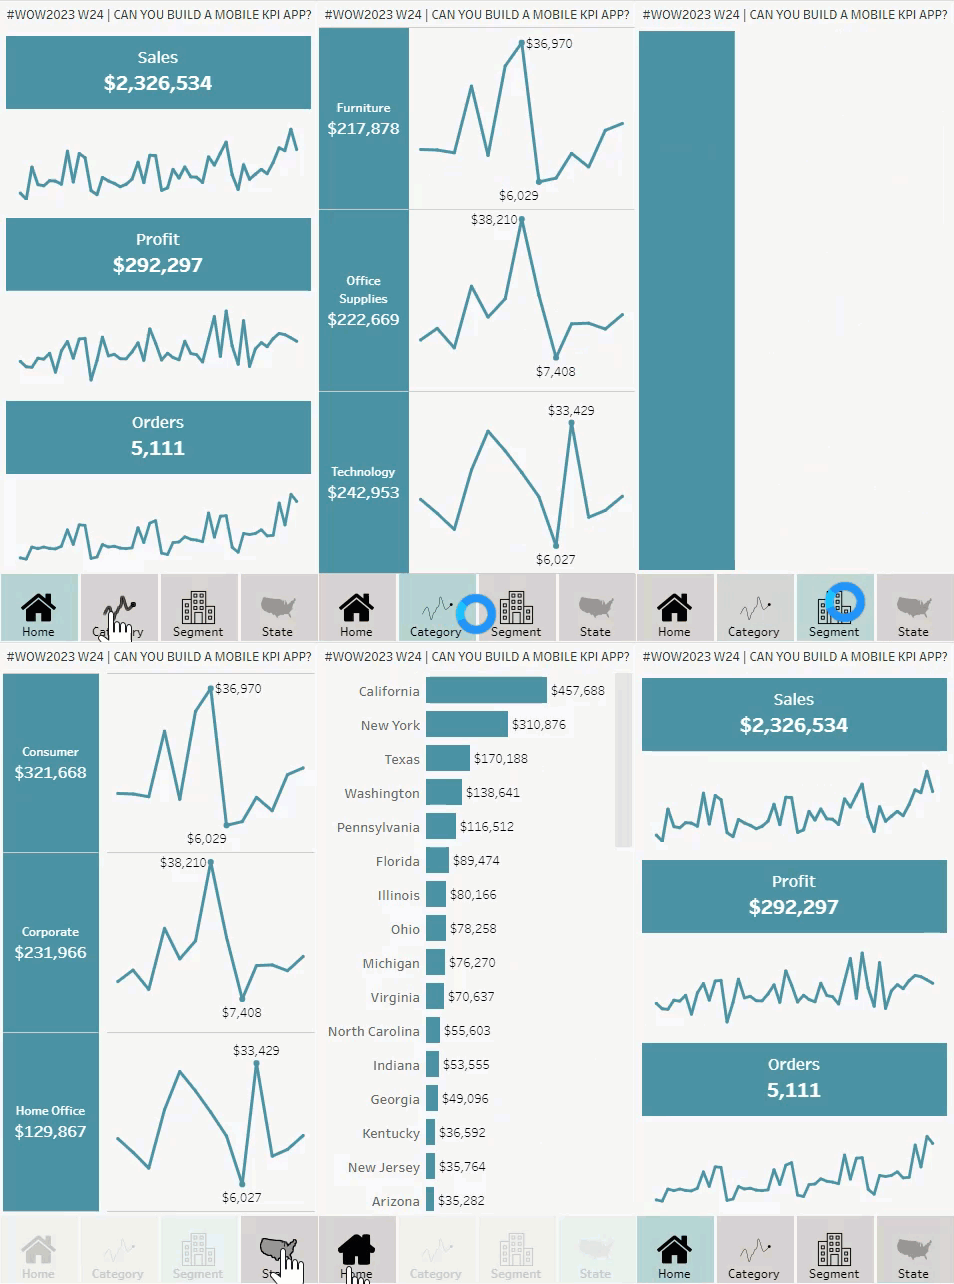
This week’s challenge is another exploration of dynamic zone visibility, this time combined with a mobile app-like concept. Sometimes executives need just a few critical metrics at their fingertips, and this is a concept I’ve mulled around for a while (probably stemming from this concept by Anya A’Hearn) but felt like dynamic zone visibility made this a bit more doable.
One thing I realized in building this is you can’t actually use dynamic zone visibility within a phone layout, so you have to actually delete the phone layout to get things to work properly if you actually were to load this on a phone.
Requirements
- Dashboard Size: 320 x 640 px
- Create KPI cards and sparklines for Sales, Profit, and Orders
- Create line charts and BANs for sales by category and segment
- Create a bar chart showing sales by state
- Create navigation buttons using the icons provided below or your own
Dataset
This week uses the Superstore data set from version 2023.1. You can find it here on Data.World
Icons can be downloaded here
Attribute
When you publish your solution on Tableau Public make sure to take the time and include a link to the original inspiration. Also include the hashtag #WOW2023 in your description to make it searchable!

Share
After you finish your workout, share on Twitter and/or LinkedIn using the hashtag #WOW2023 #Tableau and tag @WorkoutWednsday
