Introduction
I am a big fan of Level of Detail calculations and this one is an oldie but goodie! That is the main focus this week, but also uses Parameter Actions & Viz in Tooltips.
Requirements
- Dashboard Size: 600 x 600
- Two Sheets
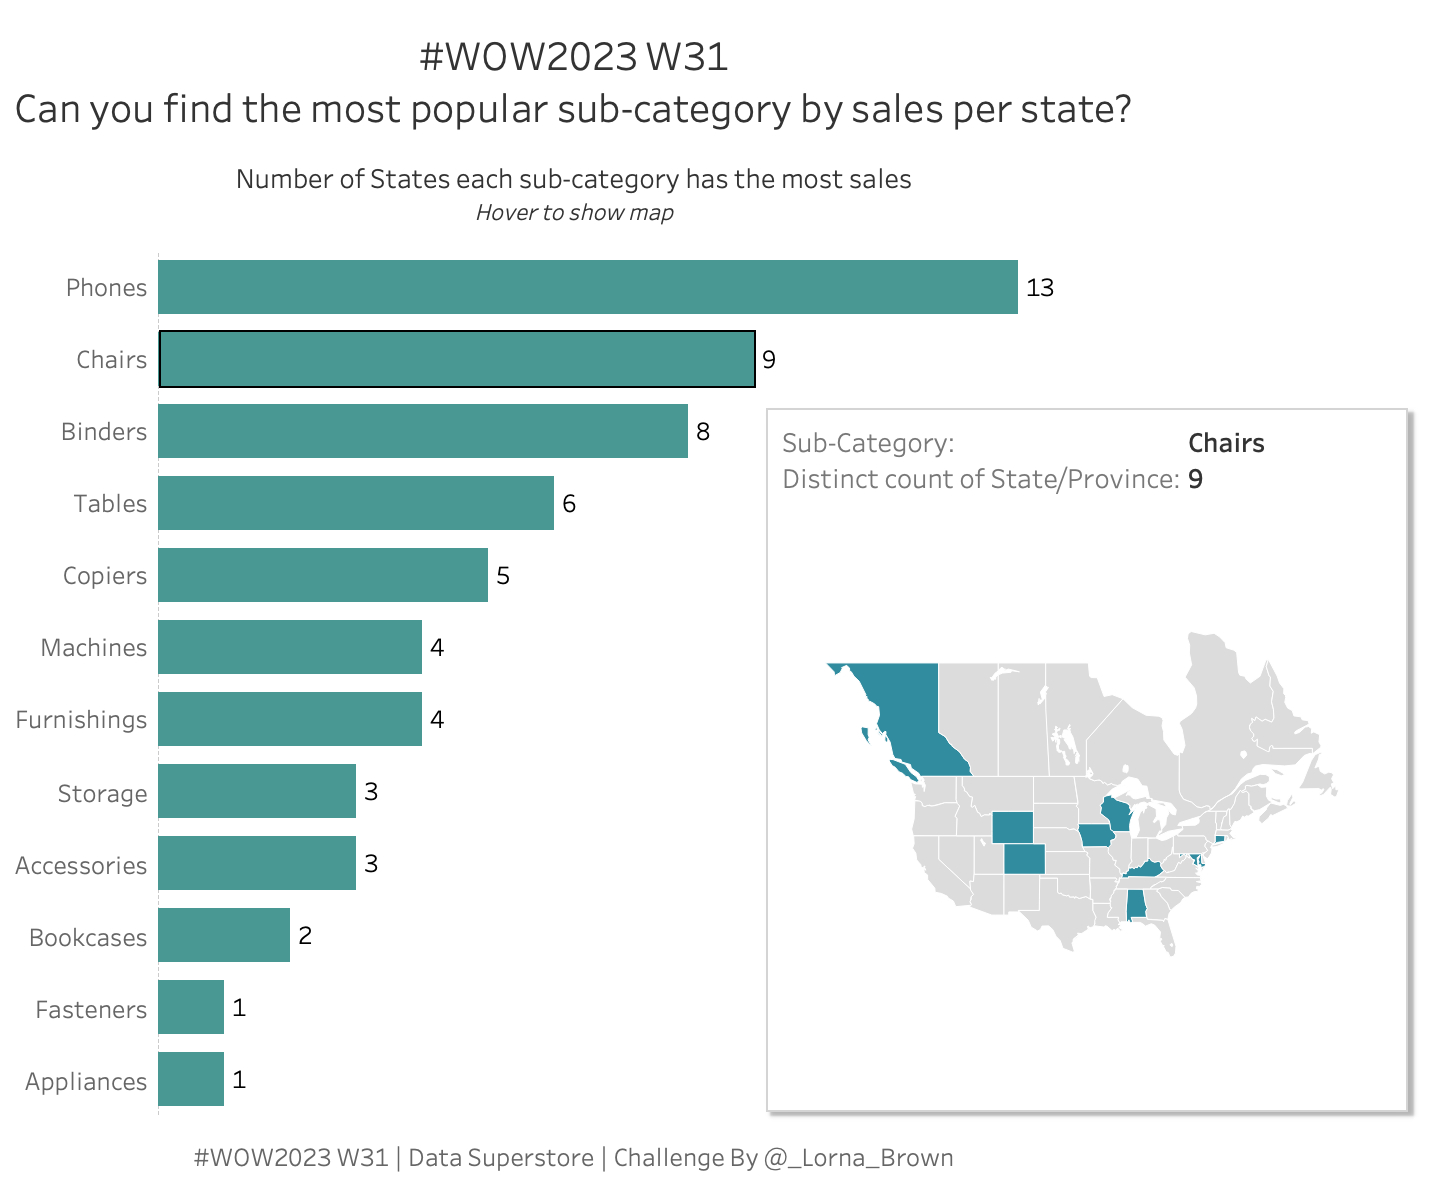
- Find the most popular sub-category by sales per state (NOTE: Nested LOD needed)
- Create a Viz in Tooltip to show which states that sub-category is most popular in
Dataset
This week uses the latest superstore dataset. You can find it here on Data.World
Attribute
When you publish your solution on Tableau Public make sure to take the time and include a link to the original inspiration. Also include the hashtag #WOW2023 in your description to make it searchable!

Share
After you finish your workout, share on Twitter and/or LinkedIn using the hashtag #WOW2023 #Tableau and tag @WorkoutWednsday
