Introduction
I’m so excited to invite Felicia Styer to the blog for this week’s challenge! Felicia is the Associate Director of Analytic Solutions at Playfair Data and hales from Kansas City, MO. Connect with her on Twitter and LinkedIn and here is her challenge!
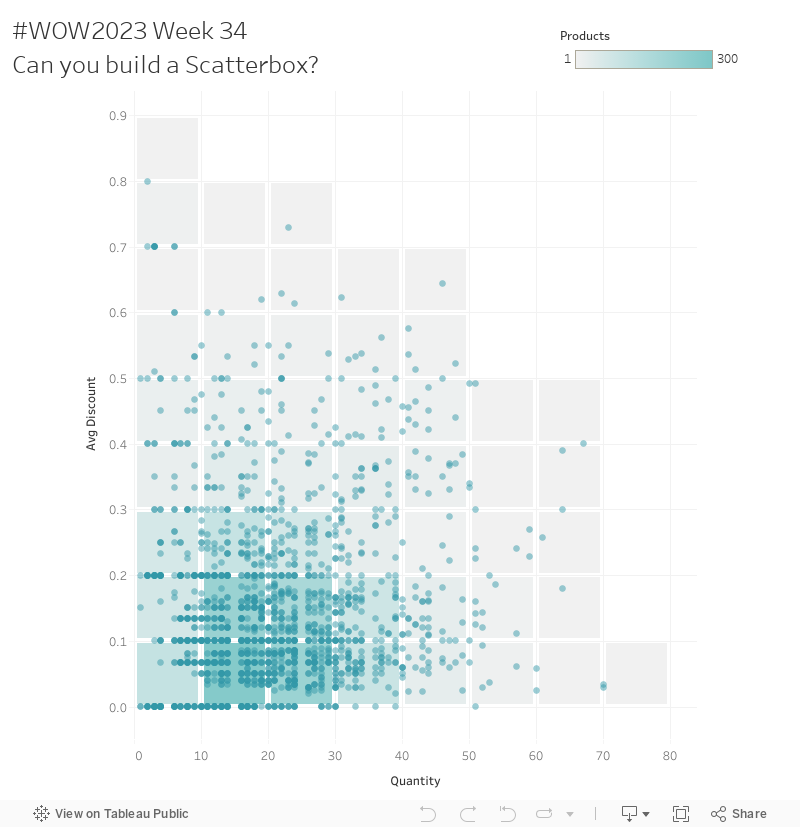
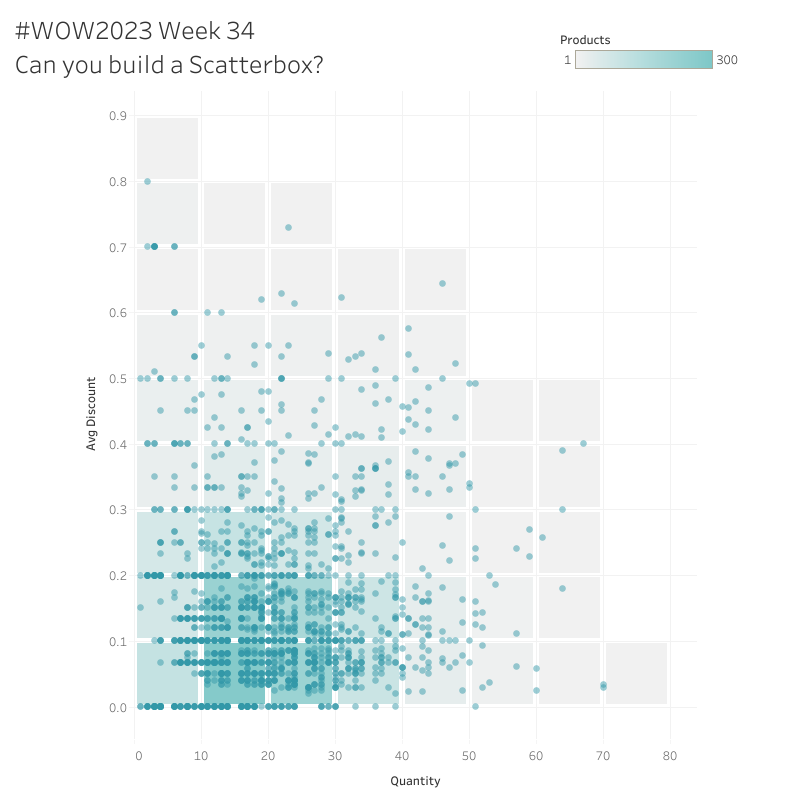
Long time fan, first time contributor! This week’s challenge is question #150 of my project #Tableau365, where I’m trying to answer 365 Tableau questions over 2023. The question came from Desireé Abbott on twitter. How can we build a scatterplot on top of a heatmap, within a single view? I found a solution, and for this week’s challenge, we’ll be applying it to Superstore.
I’ve nicknamed this chart type ‘Scatterboxes’. It’s a handy way to compare sections of a scatterplot. This would be useful when you have multiple clusters and want to compare densities, or need a better way to signal just how many marks are represented by one layered dot.
Requirements
Dashboard Size 800 x 800
One sheet
Include a scatterplot of Products by Quantity and Average Discount.
Include a heatmap
Color by number of Products.
Squares in the heatmap represent Quantity bins of 10, beginning with 0 – 10, and bins of .1 beginning with 0 – .1 for Discount.
Squares are evenly spaced, and there is white space between them.
Squares are centered on the areas they represent.
Advanced: Each square in the heatmap is represented by a single mark.
Create both charts on a single view, then overlay the scatterplot and heatmap.
Make sure the axes are synchronized.
Hint: I did not use map layers.
Hint: I unioned the data to itself to accomplish this. If you do this, make sure final values aren’t duplicated!
Customize tooltips
Scatterplot tooltips should give information about the Product
Heatmap tooltips should include the Quantity and Discount ranges, and the number of Products.
Dataset
This week uses Superstore data set. You can find it here on Data.World
Attribute
When you publish your solution on Tableau Public make sure to take the time and include a link to the original inspiration. Also include the hashtag #WOW2023 in your description to make it searchable!

Share
After you finish your workout, share on Twitter and/or LinkedIn using the hashtag #WOW2023 #Tableau and tag @WorkoutWednsday and @Graph_Hopper
Solution
Interactive