Introduction
As we finish up Global Recognition Month, I’d like to introduce you to Shunta Nakajima (@Dandee_House), a BI Engineer from Japan who has been a regular participant in #WOW2023 challenges. Over to you Shunta….
[JP]
私がWorkoutWednesdayを知ったのが2020年、それ以来約3年間多くのチャレンジに取り組み、非常にたくさんのことを学ぶことができました。WOWのおかげで、私のTableauスキルを向上させることができました。今回、ゲストとして私のチャレンジを紹介できることになり、非常にワクワクしています。 Kyle,どうもありがとう!
さて、今回のチャレンジでは私の大好きなチャートタイプの1つである、棒グラフとローソクの組み合わせを題材にしました。
私が初めてこのチャートタイプを知ったのは、かつてこのWOWを立ち上げ、またもう一つの素晴らしいコミュニティイベントであるMakeoverMondayを最近まで主宰していたAndy KriebelさんのVizです。
彼の表現方法を一目見て「すごく良いな」と思い、私も自身が作るVizのいくつかに取り入れるようになりました。
このチャートタイプの作成方法について詳細を知りたい場合は、彼のYoutube動画 を参照ください。
また、チャレンジには私がWOWを通して学んだいくつかのテクニックも盛り込んでいます。 それでは楽しんでください!
[EN]
The first time I came across WorkoutWednesday was in 2020, since then, I have worked on many challenges for about 3 years, gaining valuable experience. WOW has played a significant role in enhancing my Tableau skills. I am very excited to introduce my challenge as a guest this time. Kyle, thank you very much!
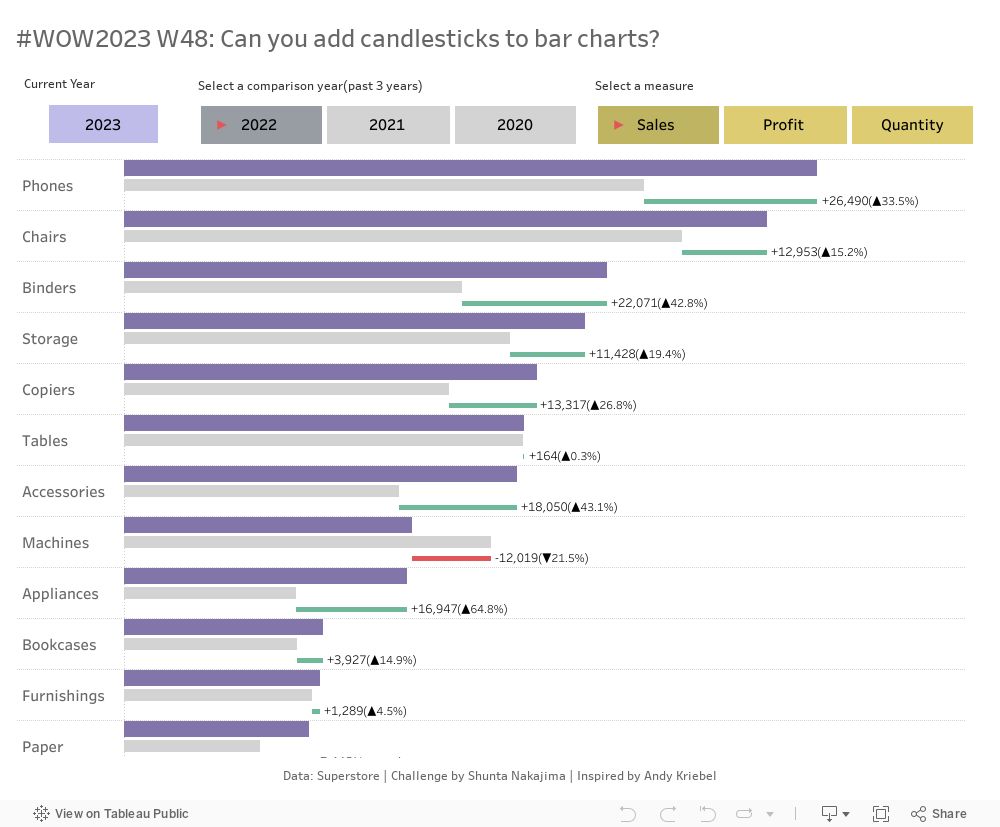
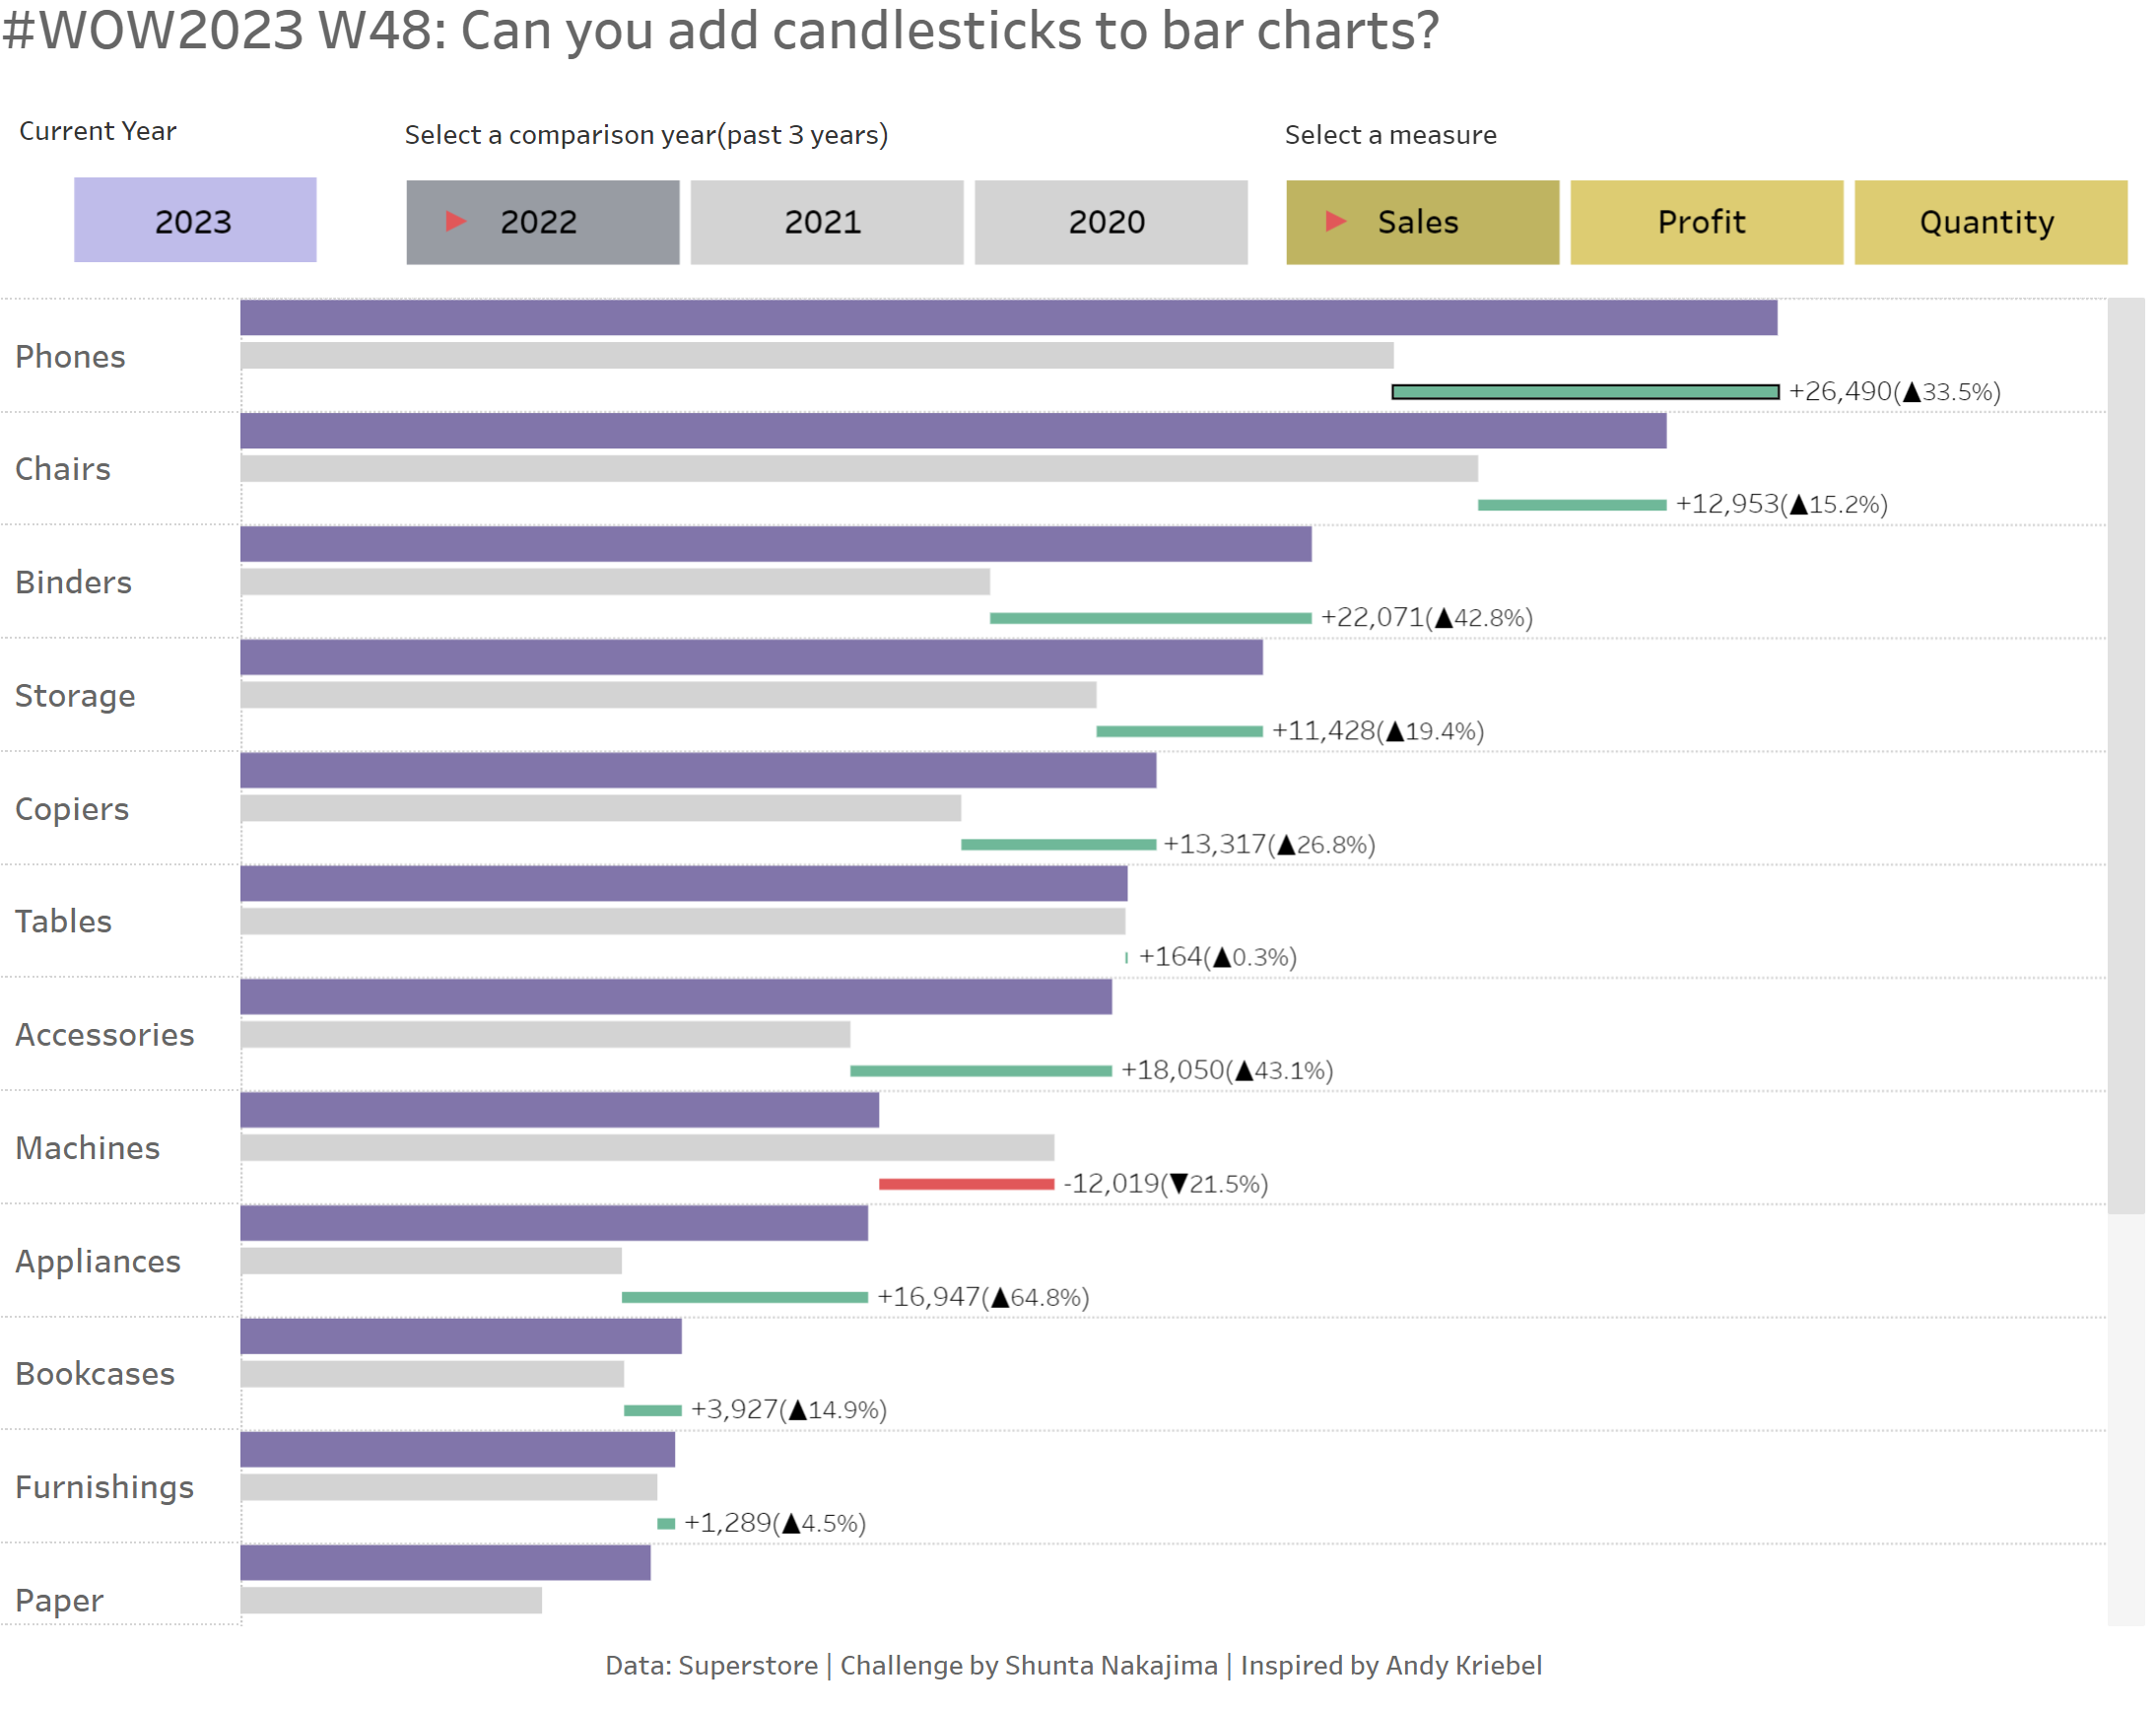
Now, for this challenge, I chose to focus on one of my favorite chart types: the combination of bar charts and candles.
I discovered this chart type through Andy Kriebel’s visualization, who once led this WOW community and until recently hosted another fantastic community event, MakeoverMonday.
I found his expression so compelling that I started incorporating it into some of the visualizations I create myself. If you want to learn more about how to create this chart type, please refer to his YouTube video.
In addition to introducing this chart type, I have included several techniques I have learned through WOW into this challenge. Have fun with it
Requirements
- 4シート
- ダッシュボードサイズ: 1000 x 800
- 最新の年(current year)と選択した年の、選択したメジャーを表す2つの棒グラフをサブカテゴリごとに作成してください
- 2つの年の差を表すローソクを作成してください 比較年、メジャーを選択する2つの選択用シートを作成してください。
- 注意:選択用シートをマークをクリックした際に、マークが選択されたままにならないようにしてください ラベル、ツールチップを揃えてください
- 注意:もし2つの年の値の符号が異なる場合、差の割合は”-“で表示してください
- 別のデータセットを使ってはいけません
- 色はお好きにどうぞ
BONUS
- 最新の年および比較年の選択肢をハードコーディングしないでください。データが更新さ れ、2024年が最新年となった場合にも修正することなくダッシュボードが更新されるよう適切な計算式を作成してください。
- 4 sheets
- Dashboard Size: 1000 x 800
- Create bar charts by Sub-Category displaying selected measure of the latest year(current year) and selected year
- Create candlesticks which show the difference between 2 years
- Create 2 selector sheets: comparison year and measure name
- Note: When you click on a mark in the selector sheets, the mark should NOT remain selected
- Match labels and tooltips
- Note: If the signs of the two year values are different, the difference % should be represented as “-“.
- NO additional datasets
- Color: as you like
BONUS
- DO NOT hard-code the latest year and comparison years. Create appropriate calculations so that this dashboard will be updated without modification accordingly to the latest data. (e.g. If 2024 becomes the latest year, the dashboard will automatically display current year as 2024 and comparison year options as 2021, 2022, and 2023. )
Dataset
This week uses the Superstore data set. You can find it here on Data.World
Attribute
When you publish your solution on Tableau Public make sure to take the time and include a link to the original inspiration. Also include the hashtag #WOW2023 in your description to make it searchable!

Share
After you finish your workout, share on Twitter and/or LinkedIn using the hashtag #WOW2023 #Tableau and tag @WorkoutWednsday
Solution
Interactive