Introduction
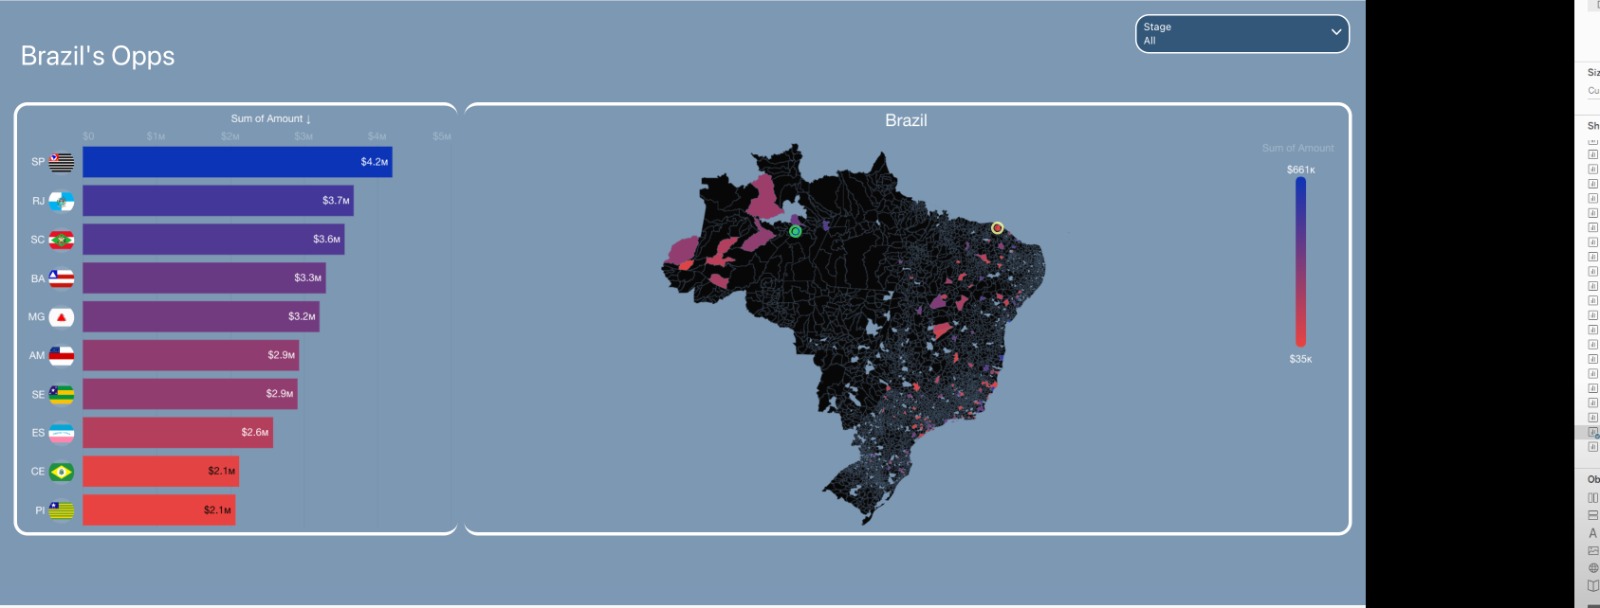
Maps, maps, and maps. We all love them, after all, in an era where data drives decision-making across industries, the significance of map charts cannot be overstated. From tracking global trends to uncovering localized patterns, these visualizations serve as powerful navigational aids in our quest for understanding. Following our trend of past challenges, this one will also be about maps in CRM Analytics. Let’s create a dynamic map chart of Brazil’s opportunities by cities.
Requirements
- Create a dev org or use an existing org you have access to;
- Upload the attached dataset;
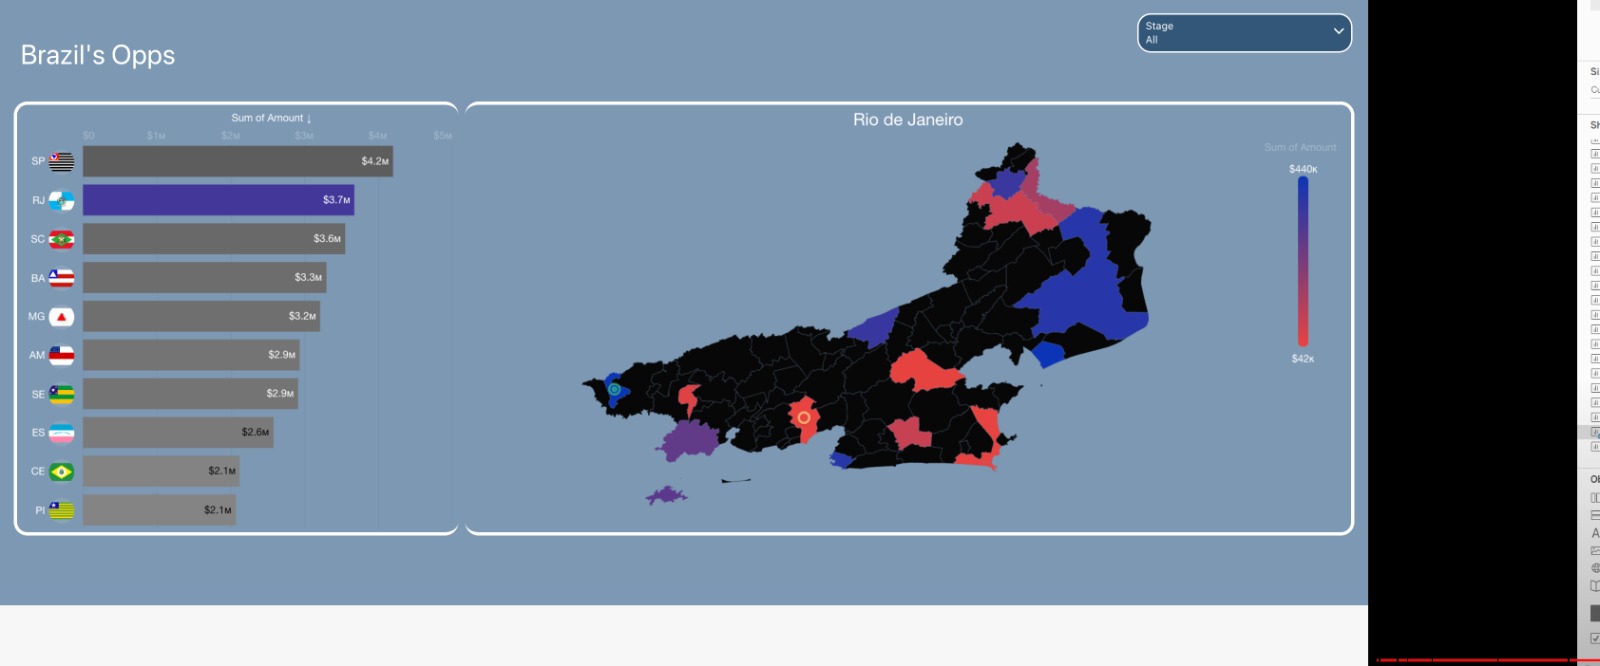
- Create Brazil’s country map and also the maps for the states SP, RJ, SC, BA, MG, AM, SE, ES, CE, PI.
- Create a bar chart of sum of opportunity amount descending by states;
- The bar chart must display the state flag;
- When you filter the dashboard by clicking in one bar state, the map should change to that state map;
- The map must contain 2 chart markers displaying the highest and lowest opp amount.
The resulting dash should look something like this:


Use default value for interactions.
Github contains Brazil’s geojson files
Dataset
Share
After you finish your workout, share a screenshot of your solutions or interesting insights.
Either on Twitter using the hashtags #WOW2024 and #CRMA and tag @genetis, @LaGMills @msayantani, and @simplysfdc. (Or you can use this handy link to do that)
Or on LinkedIn, tagging Alex Waleczek, Lauren Mills, Sayantani Mitra, Phillip Schrijnemaekers and Johan Yu using the hashtags #WOW2024
Also make sure to fill out the Submission Tracker to track your progress and help us judge the difficulty of our challenges.

