Introduction
This week, I was inspired by a post in the Sigma Community from Mark Ruesink that showed a really clever way to visualize outliers in Sigma using a combo chart and some clever calculations.
Mark goes all the way to visualizing outliers, so I definitely recommend checking out his full post, but I wanted to share a version of this that covers creating a trend line, upper, and lower bounds based on time series data. Let’s get to it!
Need access to Sigma?
Note: You will only have view access to WOW Workbooks, Folders, and Workspaces, not edit access. Please create your WOW Workbooks under “My Documents.” We suggest creating a folder to organize all your workbooks.
Requirements
- Getting your data
- Create a table element from the data Sigma Sample Database > RETAIL > MLB_STADIUM_SALES > MLB_STADIUM_SALES_HANDS_ON_LAB
- Limit your fields to Sales Quantity and Game Date
- Adding calculations
- Group by Day of Game Date
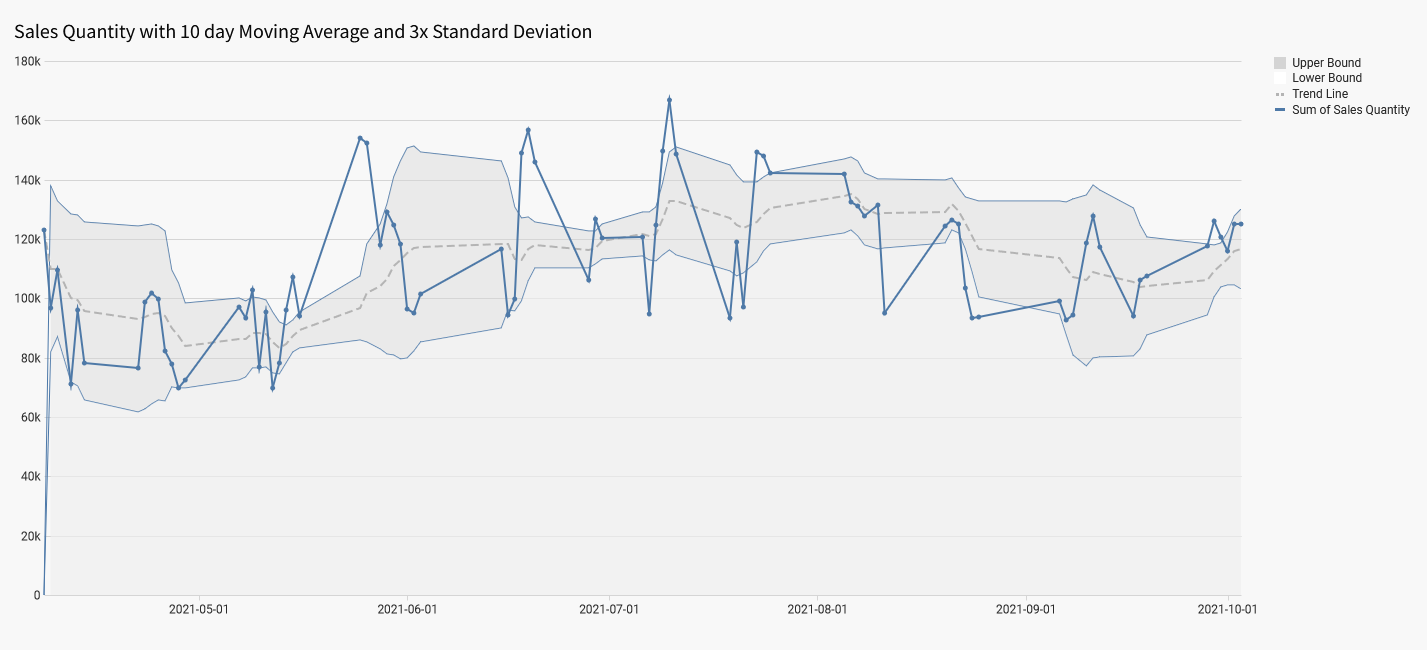
- Add calculations for the following:
- Sum of Sales Quantity
- Trend Line: 10 day Moving Average
- MovingStddev of Trend Line: 10 day Moving Std Dev
- Upper Bound: Trend Line + 3 x MovingStddev of Trend Line
- Lower Bound: Trend Line – 3 x MovingStddev of Trend Line
- Create a combo chart
- X-axis
- Day of Game Date
- Y-axis
- Upper Bound – Area
- Lower Bound – Area
- Trend Line – Line (Make it dashed in the Element Format options under Area/Line style)
- Sum of Sales Quantity – Line (Show Points in Element Format options under Area/Line style)
- X-axis
- Format the colors to ‘hide’ the lower bound
- Change Upper Bound’s color to a light grey
- Change Lower Bound’s color to white
- Go into the Element Format options, Show Background, and change the background color by using the eyedropper on the ‘lower bound’ part of the chart, this should give the appearance of making it disappear.
- Adjust other colors, as desired!
Dataset
Sigma Sample Database > RETAIL > MLB_STADIUM_SALES > MLB_STADIUM_SALES_HANDS_ON_LAB
Share
After you finish your workout, share on LinkedIn, Sigma’s Community page, (or Twitter) using the hashtags #WOW2024 and #SigmaComputing, and tag Ashley Bennett, Eric Heidbreder, Katrina Menne, and Michal Shaffer!
Create an interactive, sharable version of your solution here.
Also, make sure to fill out the Submission Tracker so that we can count you as a participant this week to track our participation throughout the year.
Solution
Coming Soon!