Introduction
Welcome to Week Thirty-Two! This week, we’re going to highlight one of Sigma’s latest enhancements to Actions. In this challenge, you’ll add actions to controls to show or hide columns in visualizations based on the column names selected in the control. This new action gives users more control over the data they want to display.
This challenge utilizes this action in a visualization, as well as a table that can be used for customizable drill-in data.
Good Luck!
-Ashley
Need access to Sigma?
Note: You will only have view access to WOW Workbooks, Folders, and Workspaces, not edit access. Please create your WOW Workbooks under “My Documents.” We suggest creating a folder to organize all your workbooks.
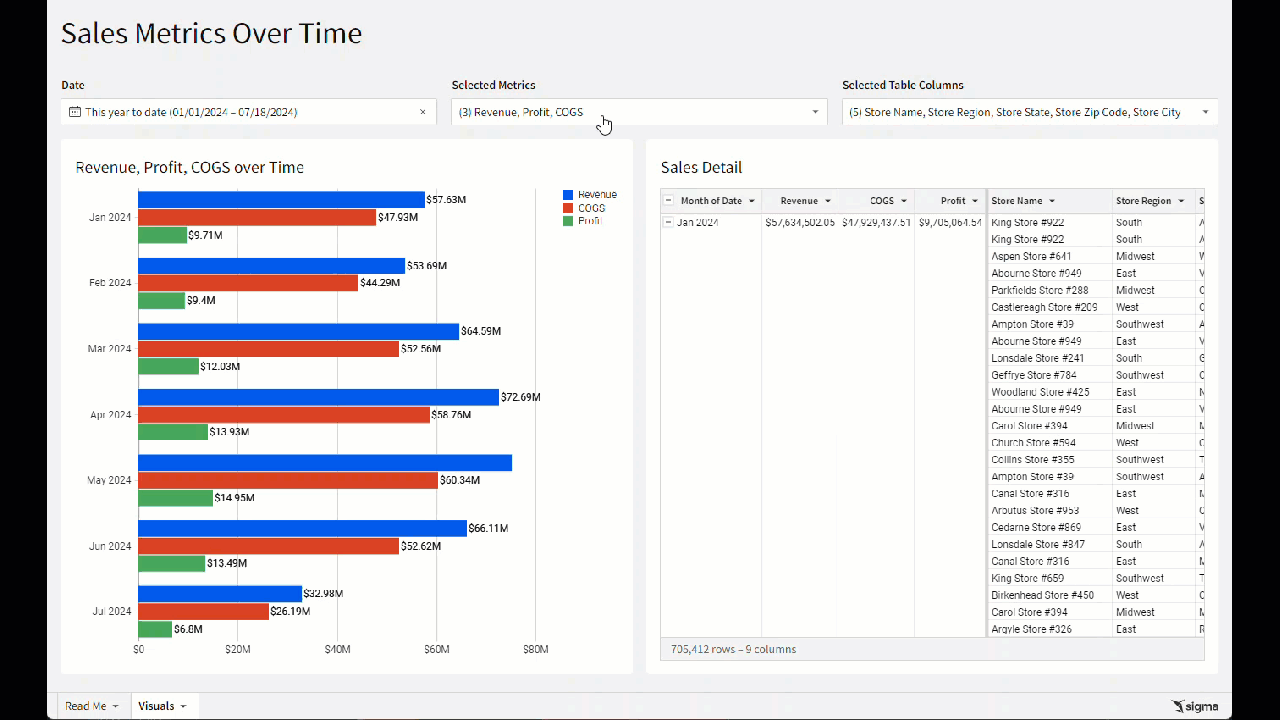
Requirements
- On a hidden Data Tab:
- Add the Plugs Electronics Hands on Lab Data
- RETAIL / PLUGS_ELECTRONICS / PLUGS_ELECTRONICS_HANDS_ON_LAB_DATA
- Note the pre-defined Metrics available. We will use COGS, Revenue, and Profit.
- Add the Plugs Electronics Hands on Lab Data
- On a visible page:
- Create an unstacked horizontal bar graph:
- X-Axis: Month of Date formatted to Month Year
- Y-Axis: Revenue, COGS, Profit
- Format each metric to SI Units
- Give each metric an explicitly defined color
- Note: This ensures that each metric will always show as the same color, regardless of which metrics the user chooses to show, providing a better user experience.
- Add a ToolTip that shows the full value of each metric, with an appropriate name, and hides the SI units value
- Create a Grouped Table
- Group by Month of Date
- Add all three metrics at this grouping level
- Hide all columns containing a Key or JSON
- Title: Sales Detail
- Group by Month of Date
- Create a Control: Selected Metrics
- Manual List containing Y-Axis metric names
- Allow Multiple Selection
- Add an action on this control that modifies the bar graph to show columns with names matching this control’s values
- Duplicate this action to apply to the table in the same way
- Update the bar graph’s title to reflect the values selected in this control. Don’t forget a default value, if no columns are selected!
- Hint: You can use ArrayJoin to convert the control’s values to a more user-friendly readable list.
- Create a Control: Selected Table Columns
- Manual List of the remaining column names
- Allow multiple selection
- Add an action on this control that modifies the table to show columns with names matching this control’s values
- Create a Control: Date Range
- Target the hidden data table, but position this control for user interaction
- Create an unstacked horizontal bar graph:
- Finishing Touches
- Give the Page a Descriptive Title that uses Dynamic Text to display the selected Characteristic and Units
- Arrange your elements into a cohesive dashboard
Dataset
RETAIL / PLUGS_ELECTRONICS / PLUGS_ELECTRONICS_HANDS_ON_LAB_DATA
Share
After you finish your workout, share on LinkedIn, Sigma’s Community page, (or Twitter) using the hashtags #WOW2024 and #SigmaComputing, and tag Ashley Bennett, Eric Heidbreder, and Katrina Menne!
Create an interactive, sharable version of your solution here.
Also, make sure to fill out the Submission Tracker so that we can count you as a participant this week to track our participation throughout the year.