Introduction
Welcome to Week Four! This week, we’re going to create a single element that shows multiple pieces for analysis.
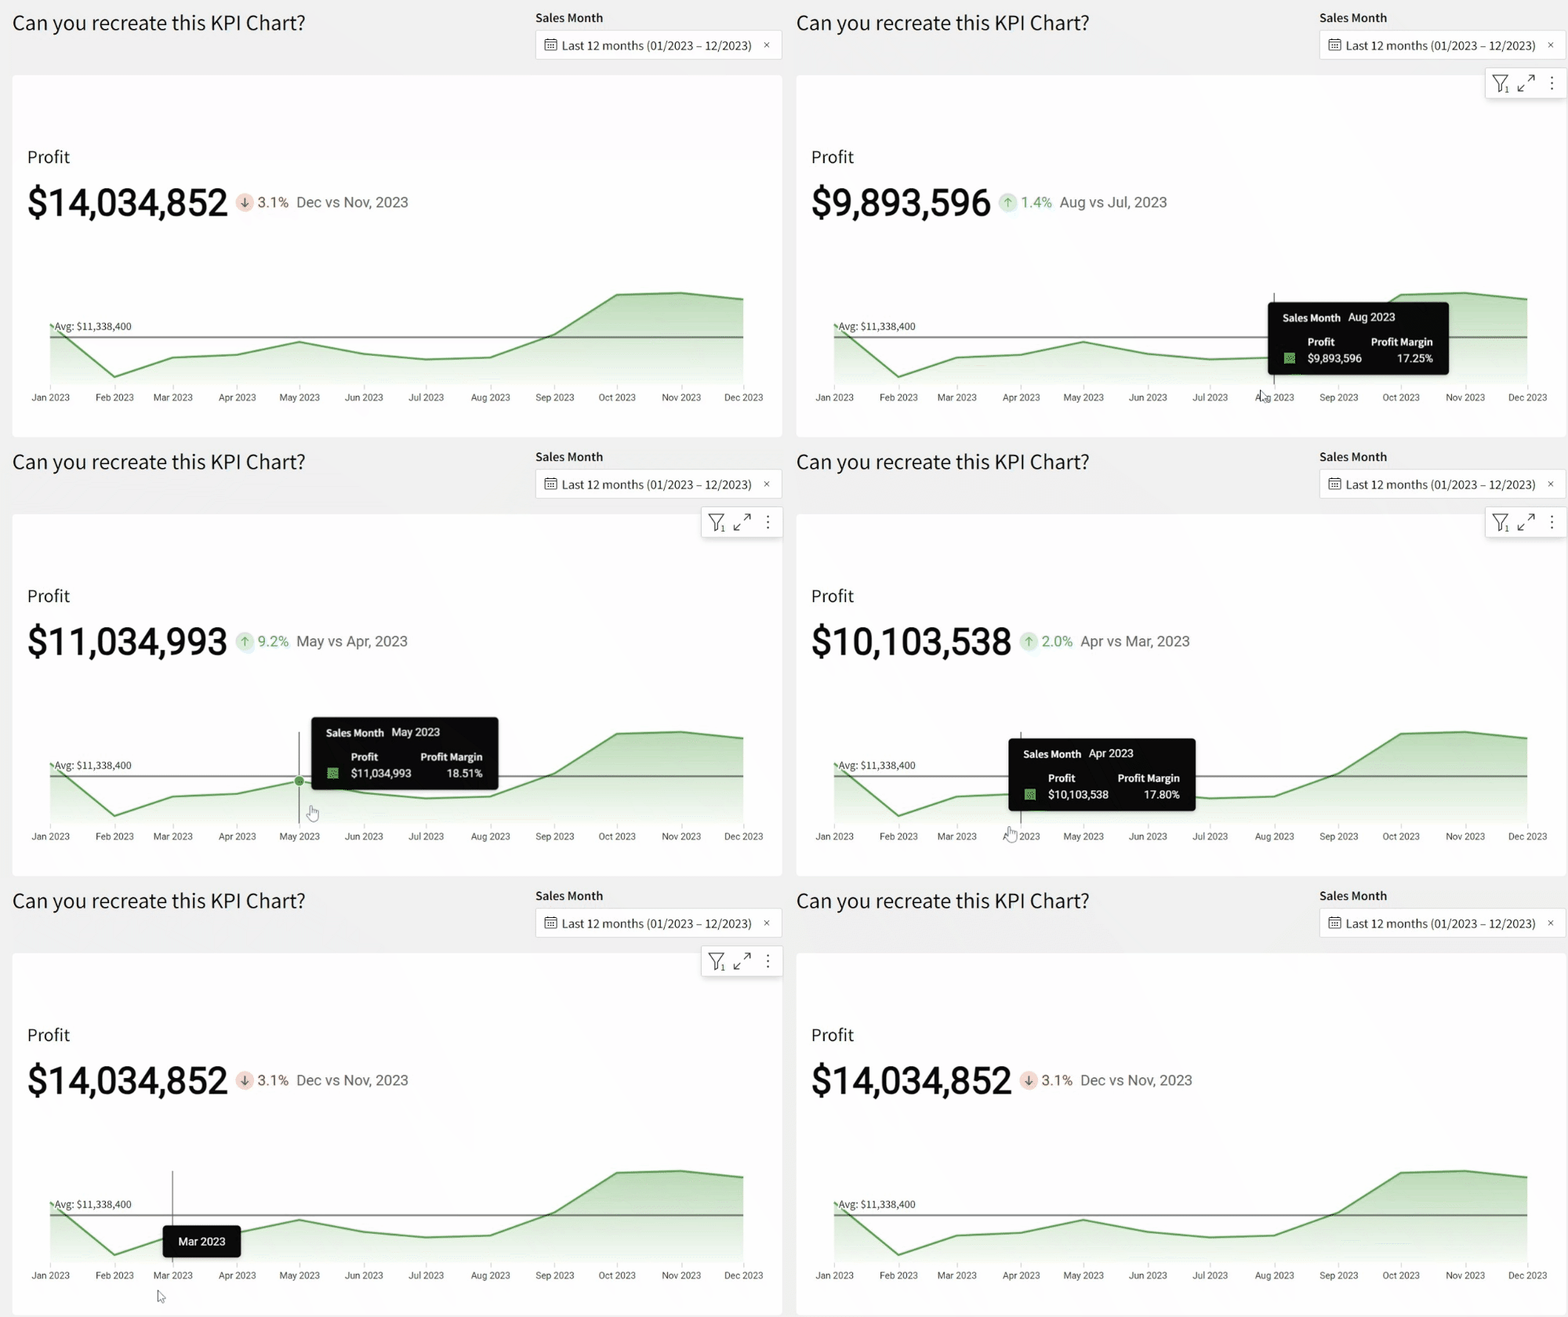
This challenge is easier than last week, and is meant to show how quickly Sigma can perform period over period analysis on any KPI.
Good Luck!
-Ashley
Need access to Sigma?
Note: You will only have view access to WOW Workbooks, Folders, and Workspaces, not edit access. Please create your WOW Workbooks under “My Documents.” We suggest creating a folder to organize all your workbooks.
Requirements
- Add a data element from PLUGS_ELECTRONICS_HANDS_ON_LAB_DATA
- Sigma Sample Database > Retail > Plugs_Electronics
- Note that ‘Profit’ and ‘Revenue’ are hiding in the ‘Metrics’ tab.
- Hidden Data Tab
- In a single visualization element:
- Show the Profit Value
- Add Sales Month to the Timeline to show a trend over time and filter to only show the last 12 months
- Perform a Period over Period analysis with a Comparison to the Previous Month
- Create a Custom Tooltip to show the Profit Margin, which is defined as Profit divided by Revenue
- Add a Reference Mark to show the Average Profit over the entire period
- Formatting Requirements:
- Profit should be formatted as a whole dollar amount
- Sales Month should be formatted as Month Year.
- Profit Margin should be formatted as a percentage with 2 decimal places.
- Trend:
- Shaped as an Area
- Color to any green you like
- Show the ToolTip and Timeline axis
- Reference Mark:
- Change the label to “Avg”
- Show the Value
- Position the value in the Top Left
- Show the Comparison to the Right of the main value
- Size your visualization appropriately
- Optional: Convert the internal Sales Month filter to a Page Control for user interaction
Analysis to consider:
- Which month had the largest percent difference when compared to the previous month?
- How many months generated an above average Profit for this period?
- Did the month with the greatest Profit also have the greatest Profit Margin?
Dataset
Sigma Sample Database > Retail > Plugs_Electronics
Share
After you finish your workout, share on LinkedIn, Sigma’s Community page, (or Twitter) using the hashtags #WOW2024 and #SigmaComputing, and tag Adrian Segura, Ashley Bennett, Eric Heidbreder, and Katrina Menne!
Also, make sure to fill out the Submission Tracker so that we can count you as a participant this week to track our participation throughout the year.
Solution


