Introduction
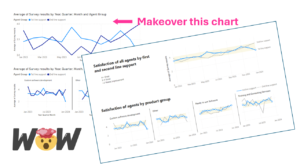
This week’s challenge is to test your data storytelling skills and enhance a line chart of service desk survey responses to focus attention on important aspects.
No solution file provided this week.

Requirements
- Obtain the data
- Model Data
- Create a chart showing survey response trends
Dataset
This week’s dataset is downloadable from Github https://github.com/kolky001/Workout-Wednesday-2023/blob/main/Help%20Desk.xlsx
or utilise a dataset from another data challenge such as Onyx Technical Support dataset (be sure to cite the datasource) https://onyxdata.co.uk/data-dna-dataset-challenge/datadna-dataset-archive/
Share
After you finish your workout, share on Twitter using the hashtags #WOW2024 and #PowerBI, and tag @MMarie, @shan_gsd, @KerryKolosko. Also make sure to fill out the Submission Tracker so that we can count you as a participant this week in order to track our participation throughout the year.
Solution
Via Data Stories Gallery
Coming soon.