
Introduction

This week have a guest author! Tausif Kazi is an expert in data visualization who is experienced in several platforms such as Sigma, Power BI, Tableau, and Snowflake.
Connect with Tausif:
Linkedin: https://www.linkedin.com/in/tausifkazi/
Twitter: https://twitter.com/VizByTK
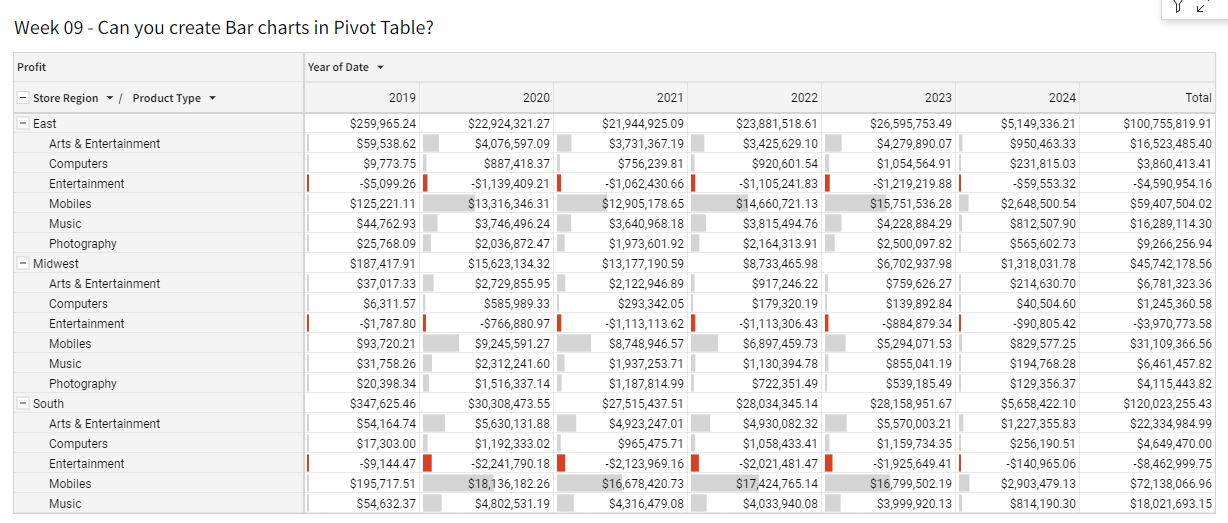
This challenge will cover how to create a Bar chart in Pivot Tables. This will help your users quickly understand the positive and negative values in the Pivot table itself.
Need access to Sigma?
Note: You will only have view access to WOW Workbooks, Folders, and Workspaces, not edit access. Please create your WOW Workbooks under “My Documents.” We suggest creating a folder to organize all your workbooks.
Requirements
- Add a data element from PLUGS_ELECTRONICS_HANDS_ON_LAB_DATA
- Sigma Sample Database > Retail > PLUGS_ELECTRONICS > PLUGS_ELECTRONICS_HANDS_ON_LAB_DATA
- Add a Pivot Table element
- Add Profit Calculation from Metrics to Values
- If you need to recreate Profit it is, Sum(([PRICE] – [COST]) * [QUANTITY])
- Format [Profit] to Currency
- Add [Store Region] then [Product Type] to Pivot Rows
- Add Year of [Date] to Pivot Columns
- Change the chart title to “Can you create Bar Charts in Pivot Table?”
- Apply a condition to format a filled bar in the Pivot Table
- Conditional Formatting Color:
- If [Profit] is Negative then #D94021
- If [Profit] is Positive then #D4D4D4
- Apply only to values (not subtotals or grand totals)
- Conditional Formatting Color:
- Pivot Table Element Size: at least 20×20
- Hide the Data Tab
Dataset
Sigma Sample Database > Retail > PLUGS_ELECTRONICS > PLUGS_ELECTRONICS_HANDS_ON_LAB_DATA
Share
After you finish your workout, share on LinkedIn, Sigma’s Community page, (or Twitter) using the hashtags #WOW2024 and #SigmaComputing, and tag Ashley Bennett, Eric Heidbreder, Katrina Menne, and our guest author Tausif Kazi!
Also, make sure to fill out the Submission Tracker so that we can count you as a participant this week to track our participation throughout the year.
Solution
- Add a table element sourced from Plugs Electronic Hands-On Lab
- Create a Pivot Table as a child element
- Add [Profit] to Values from the Metrics Tab
- Format [Profit] as Currency
- Add [Date] to Pivot Table Columns
- Change Date Truncation to Year
- DateTrunc(“year”, [Date])
- Add [Store Region] to Pivot Table Rows
- Add [Product Type] to Pivot Table Rows
- Click Element Format (Paintbrush icon)
- Click Conditional formatting
- Change “Apply to” to only be Profit
- Click “Data Bars”
- Click the Negative color value and change the hex code to #D94021
- Click the Positive color value and change the hex code to #D4D4D4
- Change the chart title to “Can you create Bar Charts in Pivot Table?”
- Move the Pivot Table Element to a separate page
- Hide the other tab with the parent table element
- Click Publish