
Introduction
This week’s challenge is going to be longer than usual, mostly because I wanted to showcase dark mode along with a combo chart. If you’re not familiar with what a combo chart is, it can represent multiple columns using different shapes. Bars, lines, areas, and points are all fair game in a combo chart, and you could even set the left and right axes to different scales (though we’re not doing that here).
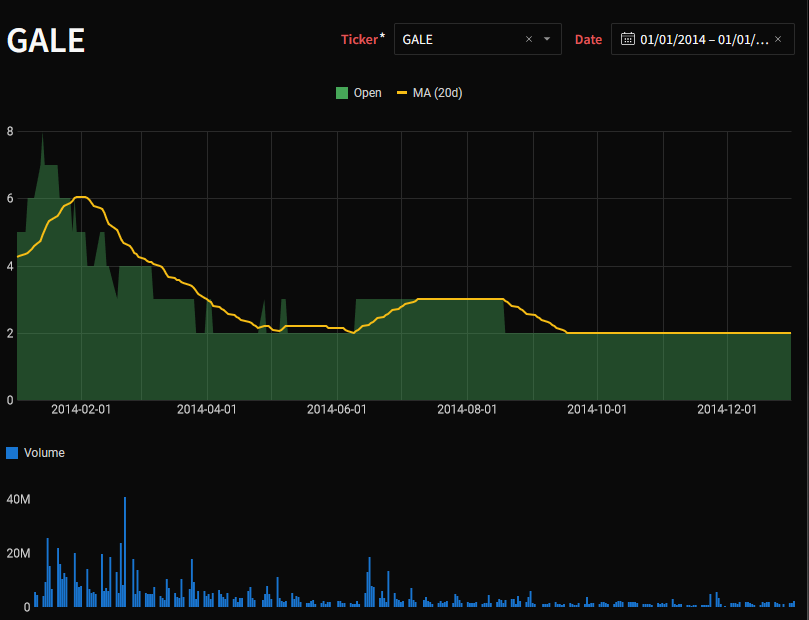
Our goal this week is to create a standard chart for tracking stock price over time, along with a 20-day moving average. As a bonus, we are adding a volume chart below.
There’s a lot of formatting options we explore this week, so it might take more time to complete. If you need to focus on just getting the combo chart done, we understand, but hope you can be inspired by some of the design ideas we showcase here!
Need access to Sigma?
Note: You will only have view access to WOW Workbooks, Folders, and Workspaces, not edit access. Please create your WOW Workbooks under “My Documents.” We suggest creating a folder to organize all your workbooks.
Requirements
- Create the source
- Create a new table and set the source to Sigma Sample Database > FINANCE > DAILY_STOCK_PRICES.
- Pull in the following fields:
- Ticker, Date, Open, Volume
- Create the transformation table
- Create a child table from the source table, you can call this new table `T__DAILY_STOCK_PRICES` – it’s our transformation table.
- Group the table by Ticker
- Add a new column, the new column should be a calculation that gets the 20d Moving Avg of the Open Rename the column as `MA (20d)`
- Create a new tab to hold your visualizations
- Customize the Workbook Theme
- Go to ‘Workbook Settings’ cogwheel at the bottom of the far left toolbar
- Change the Theme to ‘Dark’
- In ‘Layout Style’ uncheck ‘Show Cards’
- Change the ‘Spacing’ to Small
- Create the Combo Chart
- Create a new visualization element
- Set the source to ‘T__DAILY_STOCK_PRICES’ (under Page Elements)
- For the type, select ‘Combo’ and right beneath that dropdown, change the selection from ‘Stacked’ to ‘No Stacking’ (The two bar chart icons)
- Add controls to filter the chart
- Add a control for Ticker and Date that target the combo chart
- Ticker (REQUIRED) – List Control that gets its values from T__DAILY_STOCK_PRICES, do not allow multiple selection. Target the Combo Chart
- Date – Date Control. Target the Combo Chart
- Set the Date control to 01/01/2014 – 01/01/2016 (or some 2 year period we have data for)
- Add a control for Ticker and Date that target the combo chart
- Format the controls and set the Label color to Red, set the label position to ‘Left’ if it is not already selected.
- Add Date to the X-Axis, make sure it gets added as the ‘Day of Date’
- Add Open and MA (20d) to the Y-Axis and uncheck ‘Aggregate Values’
- Right click on Open
- Change its shape to ‘Area’
- Deselect ‘Show in Tooltip’
- Right click on MA (20d)
- Change it to ‘Line’ (if it isn’t already)
- Deselect ‘Show in Tooltip’
- Customize the tooltip
- Duplicate the Open and MA (20d) columns, then add them to the Tooltip. You can rename them Open Price and MA(20d) Open Price to avoid auto-generated names
- Add Volume to the tooltip
- Format the chart
- Change the position of the Legend to ‘Top’
- Ensure gridlines are set to ‘Show’ for both the X and Y Axes
- Uncheck ‘Show zero guideline’ for the Y-Axis
- Hide the title of the chart (we’re going to add a text box title so we can put the controls in line with the title)
- Update the colors of the chart so that Open is green, and MA (20d) is Yellow
- Create the title
- Create a new text UI Element with dynamic text that references the ‘Ticker’ control value
- Set the font to ‘Medium Heading’ and make it bold
- Arrange the elements on the page
- Move the new text element and the controls so that they all sit on top of the combo chart
- BONUS: Add the ‘Volume’ bar chart
- Use the same source as the Combo Chart
- This is a simple bar chart of Volume over Date
- Format the bar chart
- Remove all gridlines from both axes
- Remove the labels from the X-axis
- Move the legend to ‘Top Left’
- Remove the title
- Position the Volume chart below the Combo Chart
- Use the same source as the Combo Chart
Dataset
Sigma Sample Database > FINANCE > DAILY_STOCK_PRICES
Note: This data does not go up to present day
Share
After you finish your workout, share on LinkedIn (or Twitter) using the hashtags #WOW2024 and #SigmaComputing, and tag Adrian Segura, Ashley Bennett, Eric Heidbreder, and Katrina Menne!
Also, make sure to fill out the Submission Tracker so that we can count you as a participant this week to track our participation throughout the year.
Solution
Coming Soon!