Introduction
Happy New Year to you all! This is the start of #WorkoutWednesday’s 7th year – how amazing is that! Thank you to everybody for your continued support and engagement – it really helps keep this initiative going!
For the first challenge of 2024, I’ve updated a visualisation I first built several years ago based on HR salary data. I’ve always felt this is a great example of really being able to ‘see’ your data, and at the time, made the HR team incredibly excited about the possibilities of Tableau.
In most organisations, employees have a grade or a pay level; something which gives an indicator of the ‘salary band’ they’re in based on their role. For example, employees in the lowest grade/pay level may be paid up to £20,000, the next level from £20,000 to £30,000 etc.
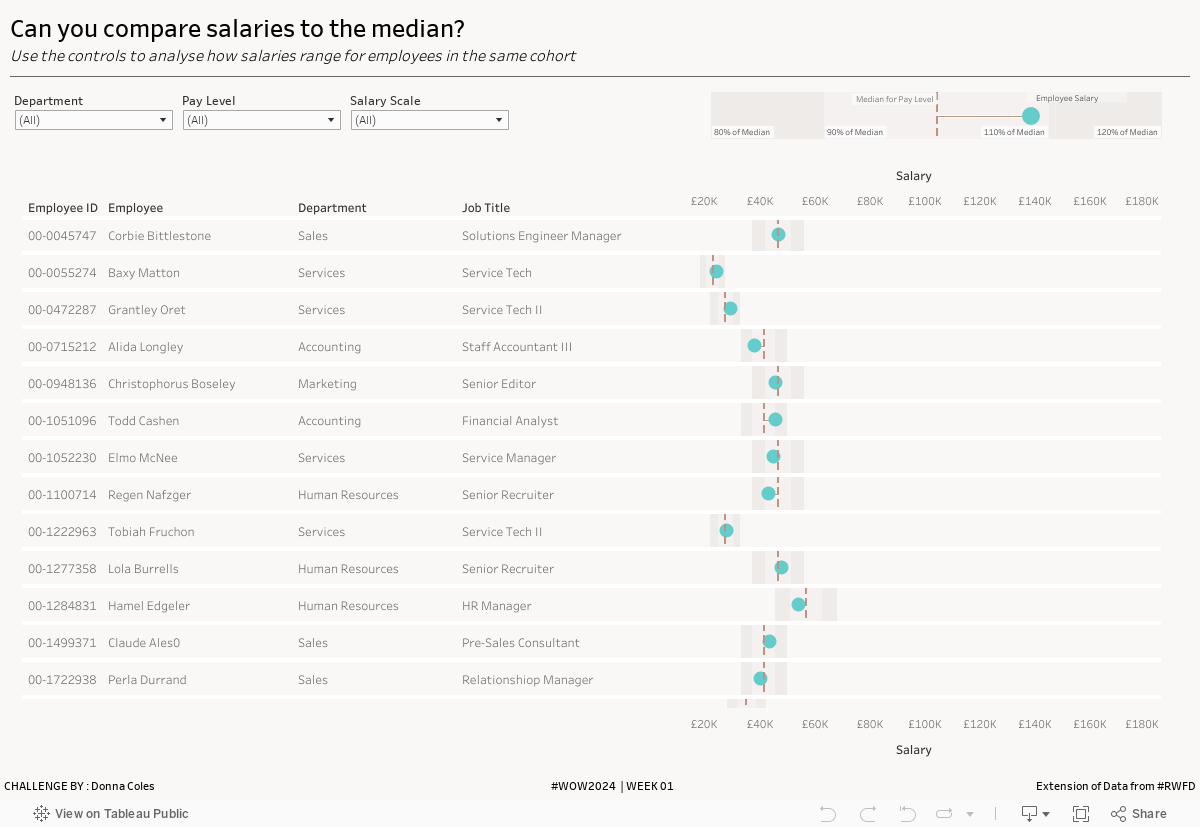
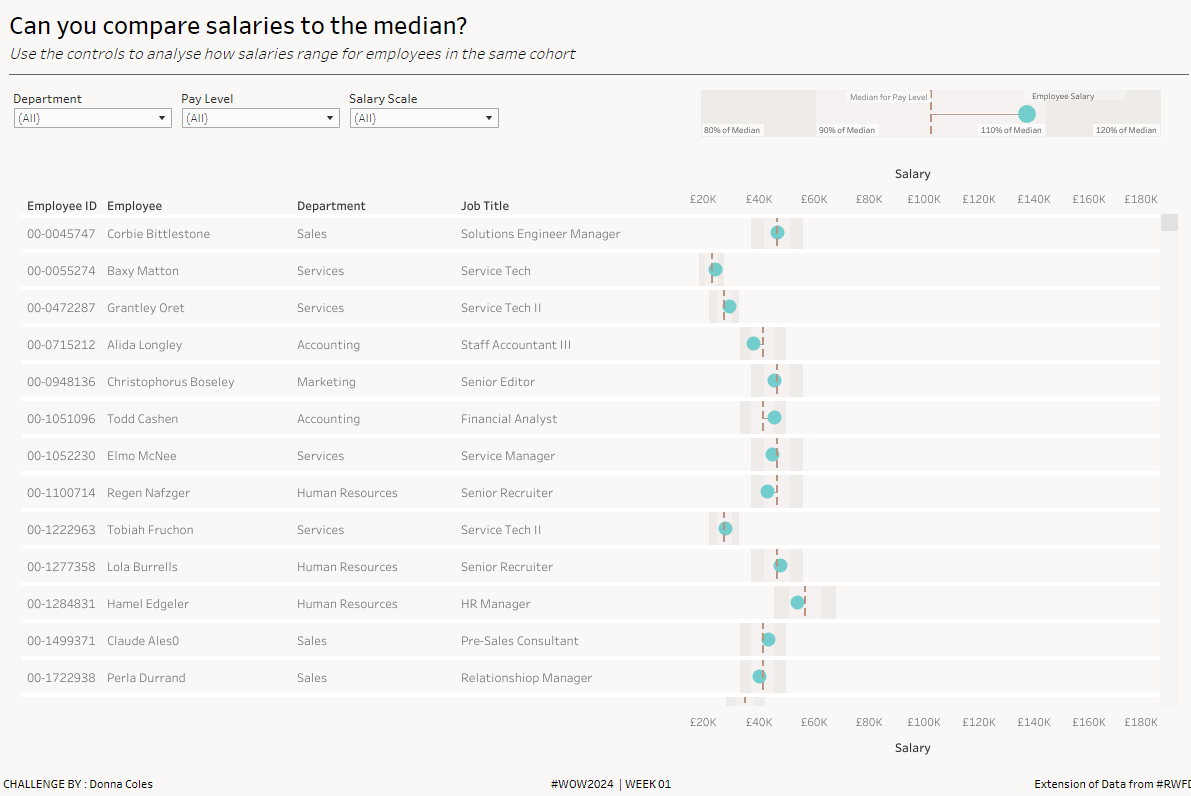
This visualisation compares an employee’s actual salary against the median salary of all employees with the same pay level (cohort). Along with this, a salary scale determines how close that employee is to the median, and then provides an effective way of being able to see how employees in the same cohort compare – are there some departments that typically pay more than others; are there employees who may need a pay increase as they’re quite adrift?
Note – I have used the median salary in this case, but this could easily be adapted to compare to other salary data such as industry salary benchmarks, providing there was a link between that and your own source data of course.
Requirements
- Dashboard 1200px x 800px
- Display a row per employee. On each row
- the circle represents the employee’s actual salary (#64cdcc)
- the dashed vertical line represents the median salary for the employee’s pay level (#ba9582)
- the coloured bandings represent the proportion of the median
- 80-90% of median (#efebe8)
- 90-110% of median (#f5f1f0)
- 110- 120% of median (#efebe8)
- Allow the user to filter the visualisation by Department, Pay Level and Salary Scale where Salary Scale is a number from 1-6 based on
- 1 : Salary is less than 80% of Median
- 2 : Salary is between 80-90% of Median
- 3 : Salary is between 90-100% of Median
- 4 : Salary is between 100-110% of Median
- 5 : Salary is between 110-120% of Median
- 6 : Salary is more than 120% of Median
- Add a legend
- Match formatting & tooltips
Dataset
This challenge uses a custom fabricated data set extended from the HR data available from the Real World Fake Data initiative (#RWFD), and is available from here.
Attribute
When you publish your solution on Tableau Public make sure to take the time and include a link to the original inspiration. Also include the hashtag #WOW2024 in your description to make it searchable!

Share
After you finish your workout, share on Twitter and/or LinkedIn using the hashtag #WOW2024 #Tableau and tag @WorkoutWednsday
Solution
Interactive