Introduction
It’s an exciting moment as we launch the first-ever Sigma Computing Workout Wednesday Challenge! WOW was a key aspect in my career, and I’m thrilled to bring these challenges to a new platform. These challenges are designed to help you explore new possibilities, practice essential concepts, and deepen your understanding of Sigma & data analytics.
So, dive in and have fun!
Need access to Sigma?
Note: You will only have view access to WOW Workbooks, Folders, and Workspaces, not edit access. Please create your WOW Workbooks under “My Documents.” We suggest creating a folder to organize all your workbooks.
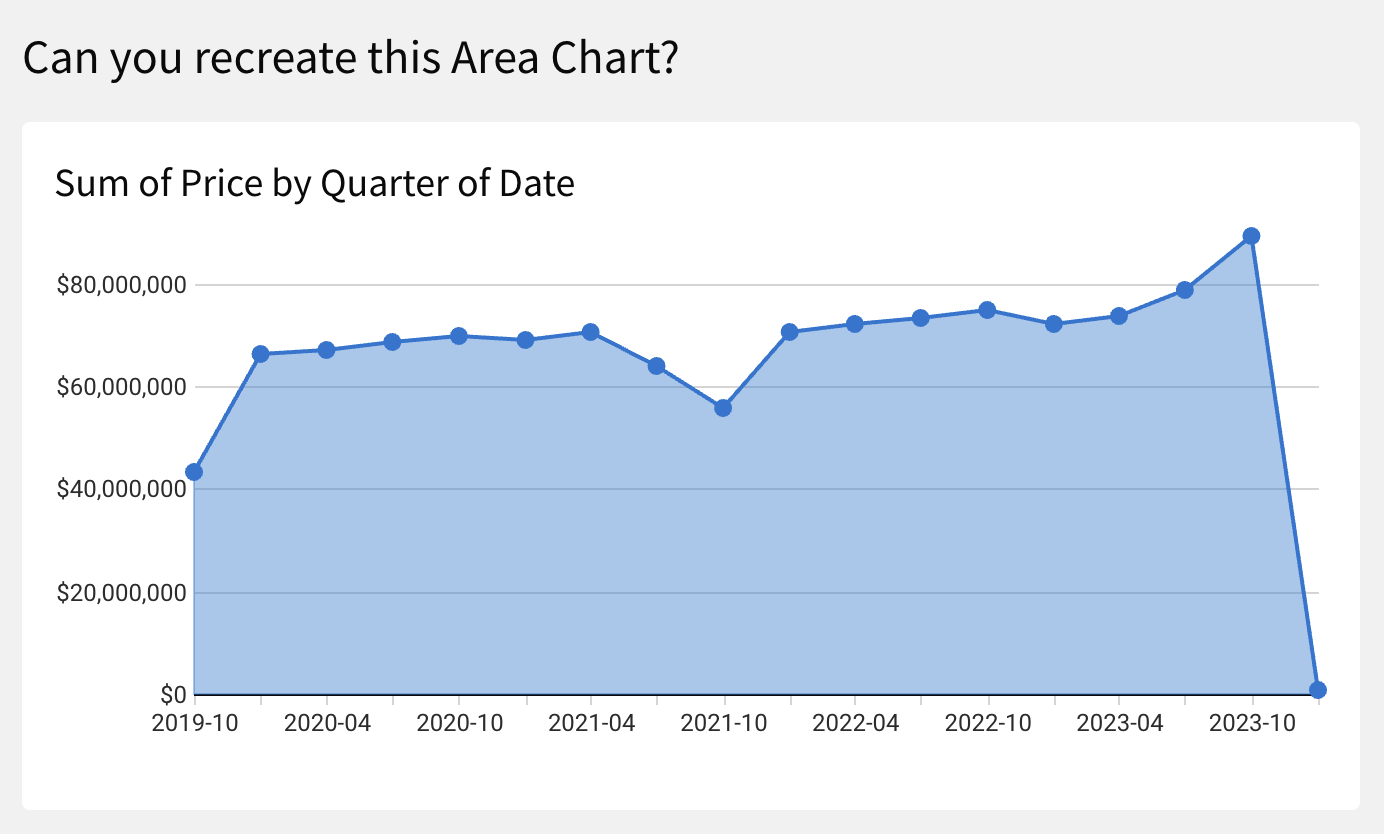
Requirements
- Add a data element from PLUGS_ELECTRONICS_HANDS_ON_LAB_DATA
- Sigma Sample Database > Retail > Plugs_Electronics
- Hide Data Tab
- Add an Area Chart Visual
- Truncate [Date] by Quarter
- Sum [Price]
- Viz Marks Color: #1976D2
- Format Style:
- Straight Solid 2px Line
- Circle Point Style 8px
- Add a Title Text Element
- Viz Element Size: at least 15×15
- Match the tooltips
Dataset
Sigma Sample Database > Retail > Plugs_Electronics
Share
After you finish your workout, share on LinkedIn (or Twitter) using the hashtags #WOW2024 and #SigmaComputing, and tag Adrian Segura, Ashley Bennett, Eric Heidbreder, and Katrina Menne!
Also, make sure to fill out the Submission Tracker so that we can count you as a participant this week to track our participation throughout the year.