Introduction
I was recently catching up on the Flerlage Twins blog, and came across a post that I had somehow missed from the end of last year about trying to solve a highlighting problem with donut charts when filtering. I read through it, and was surprised that my favorite technique from Yuri Fal didn’t work, and the solution Ken landed on required adding another data source/relationship. So I decided to give it a try and see if I could match the desired behavior without bringing in another data set. I was successful, so that’s your challenge this week.
Requirements
- Dashboard size: 500×700
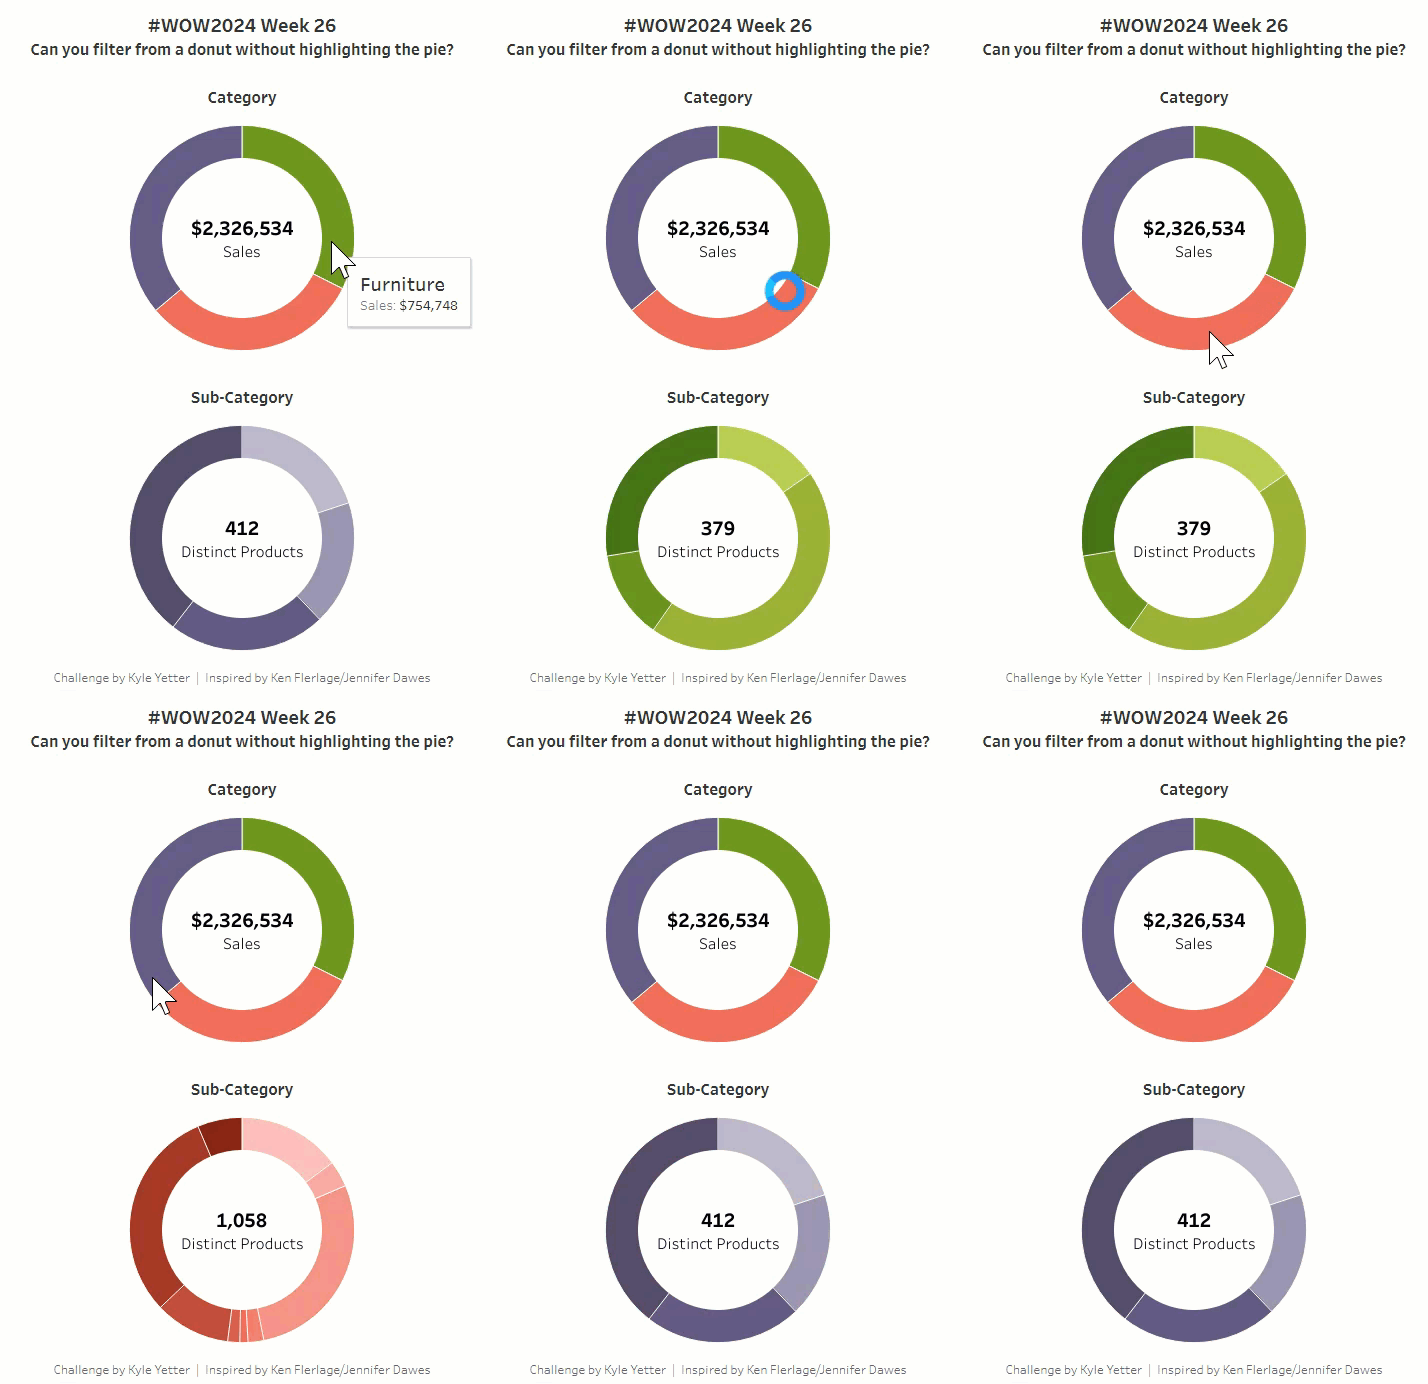
- Create a donut chart showing Sales by Category, with a label of total sales inside the donut
- Create a second donut chart showing Sales by Sub-Category, with a label of distinct product count for the selected category
- Clicking on the Category chart should filter the Sub-Category chart to only the Sub-Categories in that Category
- When clicking the Category chart, the pie piece should not highlight at all
- Sub-Category colors gradient should align with Category colors
- No scaffolding or secondary datasets
Dataset
This challenge uses Superstore, and is available from here.
Attribute
When you publish your solution on Tableau Public make sure to take the time and include a link to the original inspiration. Also include the hashtag #WOW2024 in your description to make it searchable!

Share
After you finish your workout, share on Twitter and/or LinkedIn using the hashtag #WOW2024 #Tableau and tag @WorkoutWednsday
